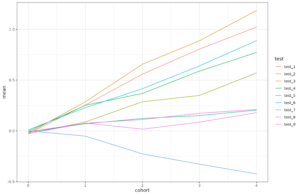
You may have seen posts like this:
Two explanations are commonly offered:
- Phones/computers got suddenly more addictive than before (Tiktok-era)
- COVID was bad for learning.
Let’s start with the second. PISA tests measure in part material covered by the school curriculum, but mainly they measure intelligence (g factor). COVID lockdowns and infections probably can’t affect intelligence in the long term (in most cases anyway), but they can affect learning in the short term. As such, we should be able to find such effects by suitable studies. I looked up some large-scale studies for Claire’s own country, Australia, and mine, Denmark.
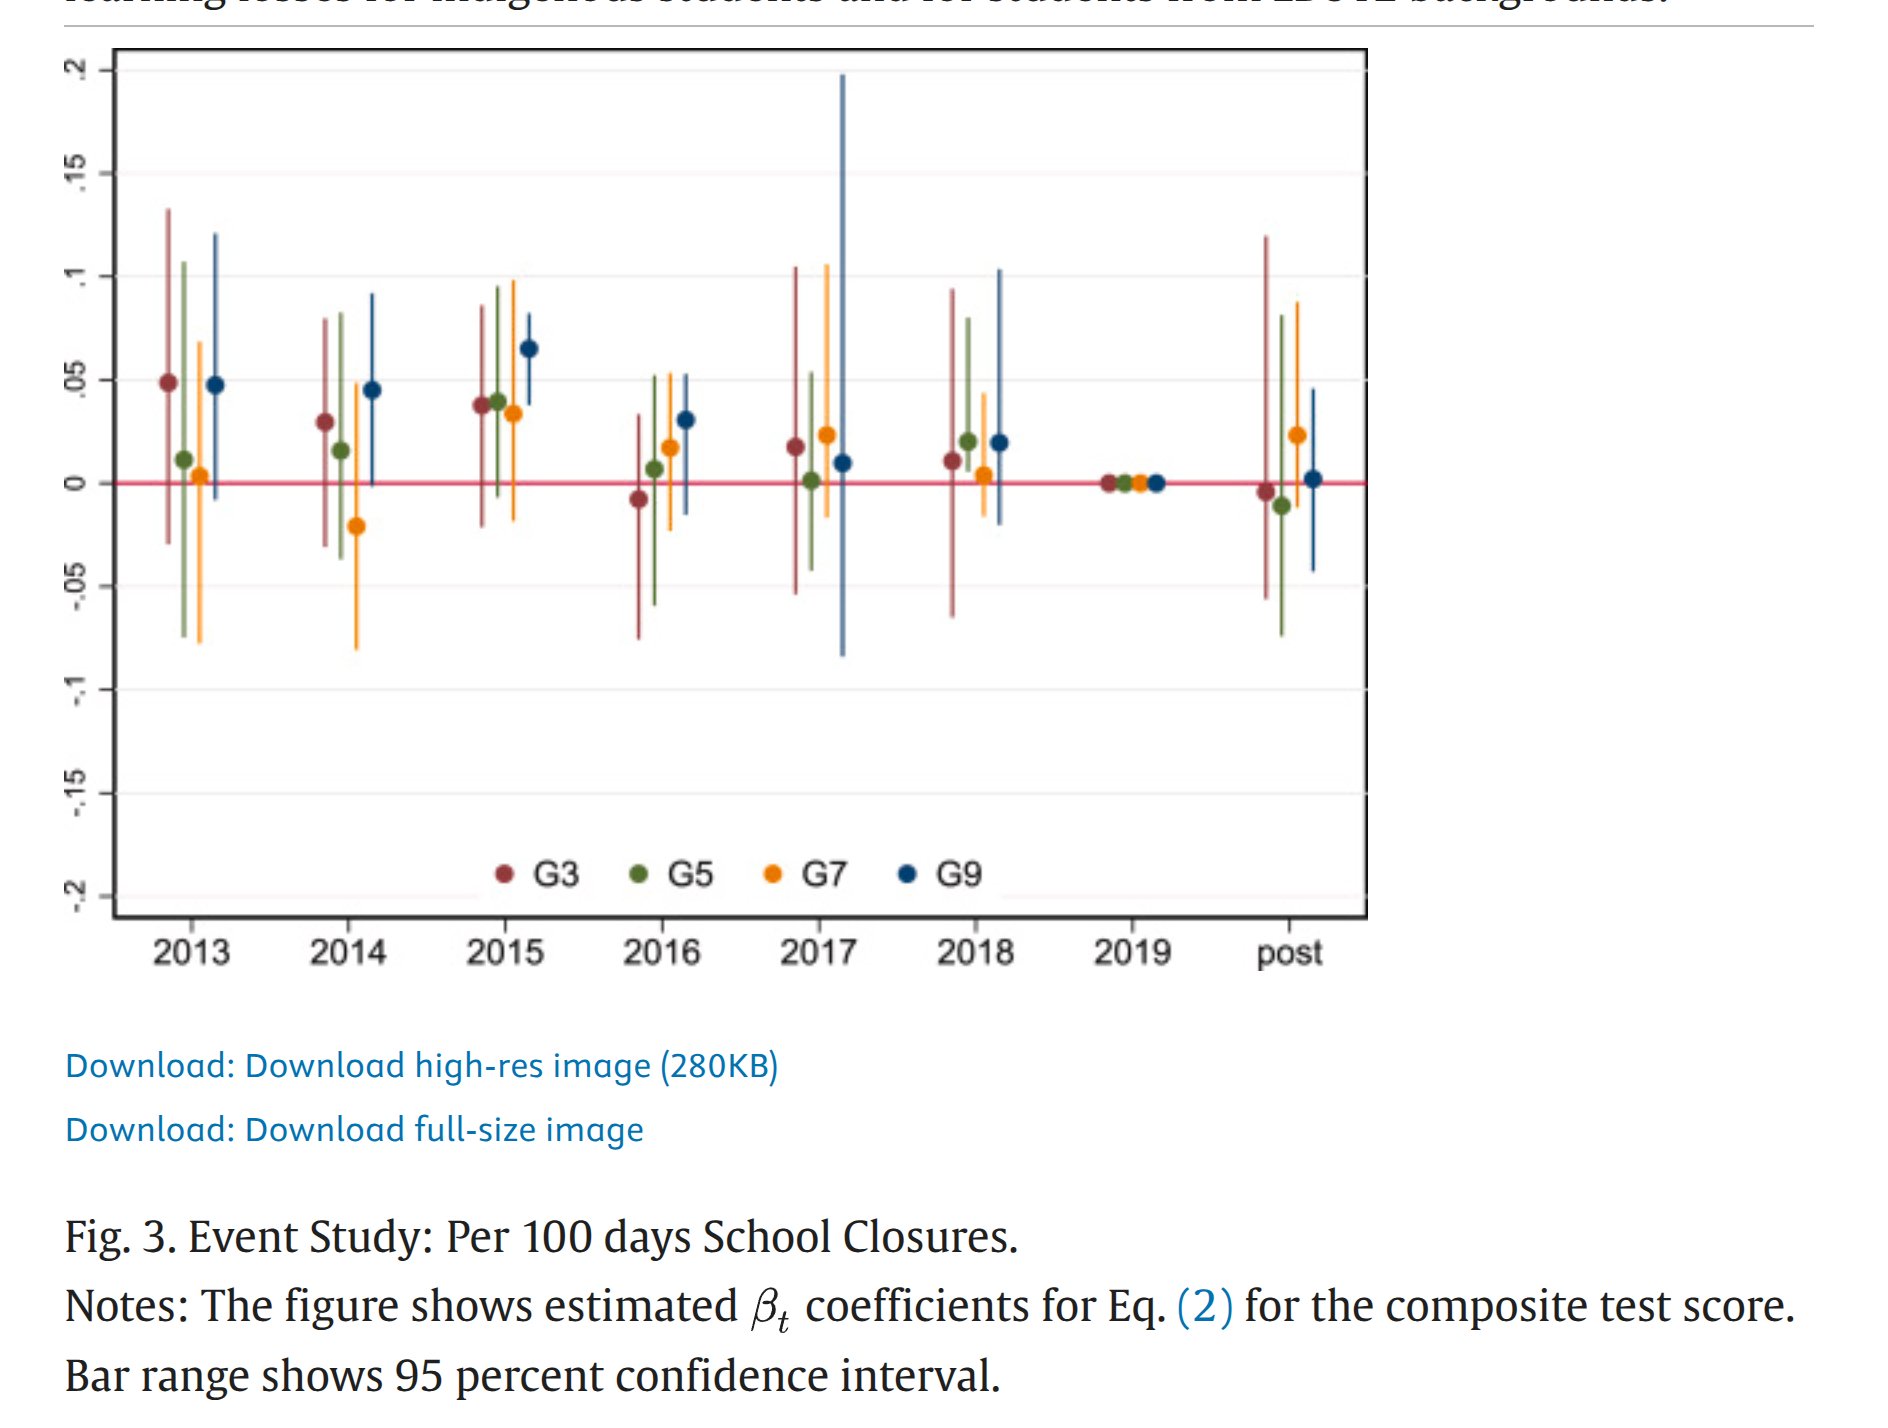
In the authors words:
We find that school closures caused small and statistically insignificant learning losses.
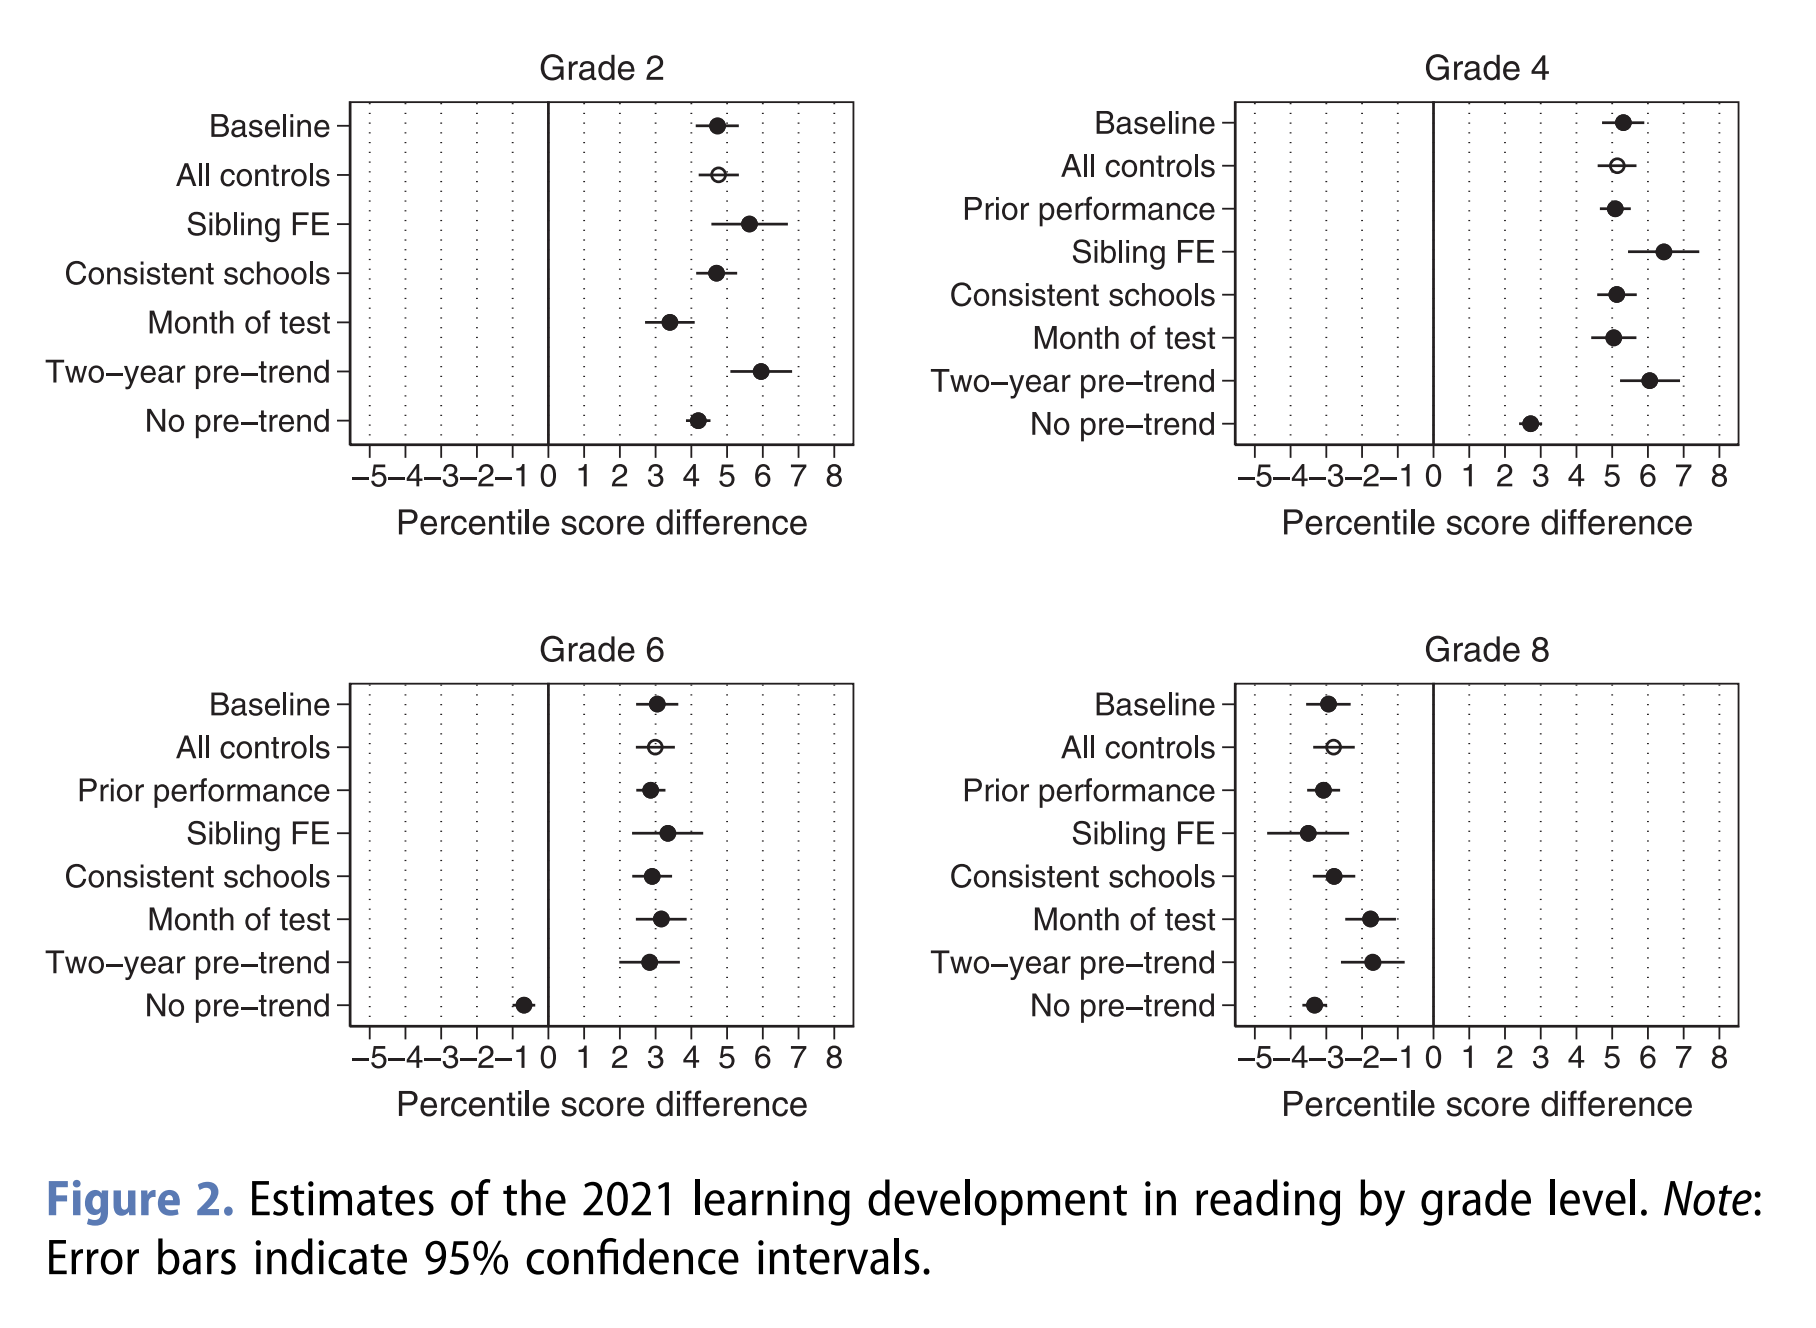
The authors:
We find no evidence of a major learning loss. While pupils in grade 8 experienced a three percentile points loss in reading performance, pupils in grades 2 and 4 experienced a learning gain of about five percentile points, possibly resulting from school closures being significantly longer among older (22 weeks) than younger children (eight weeks).
The effect sizes are fairly trivial. 3 percentile points is about 1 IQ at the 50th centile to 53rd. Note that grade 8 is about the same as age the PISA tests (age 14 vs. 15 for PISA).
I don’t think it’s phones/devices suddenly having a massive effect while we had addictive gagdets for years.
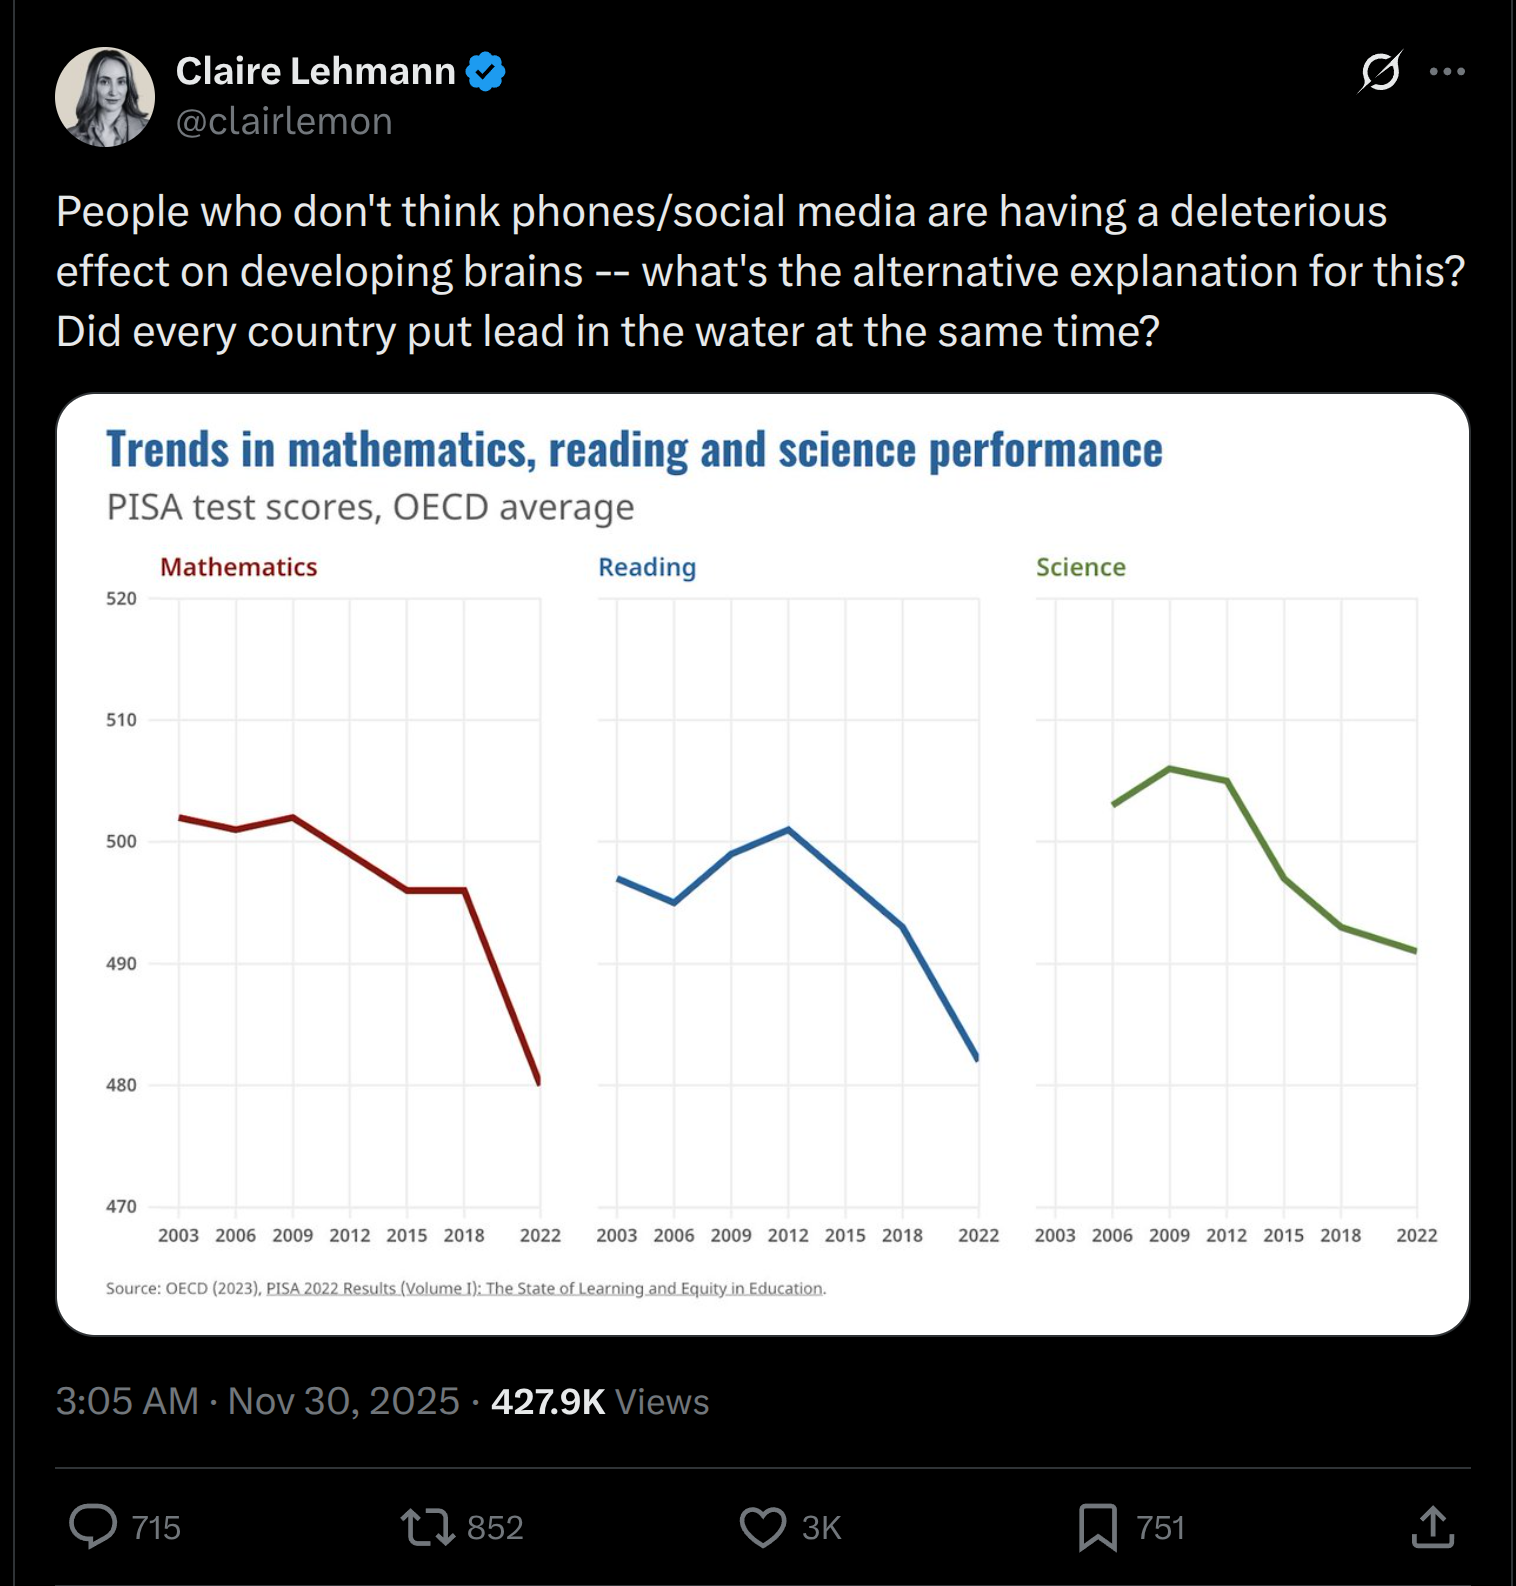
I couldn’t find the source of that particular PISA plot that Claire Lehmann posted. However, I did what presumably most commenters didn’t: I skimmed the actual PISA reports, both the main one and the technical one (~1000 pages combined). In them, one can find a plot like the one floating on X:
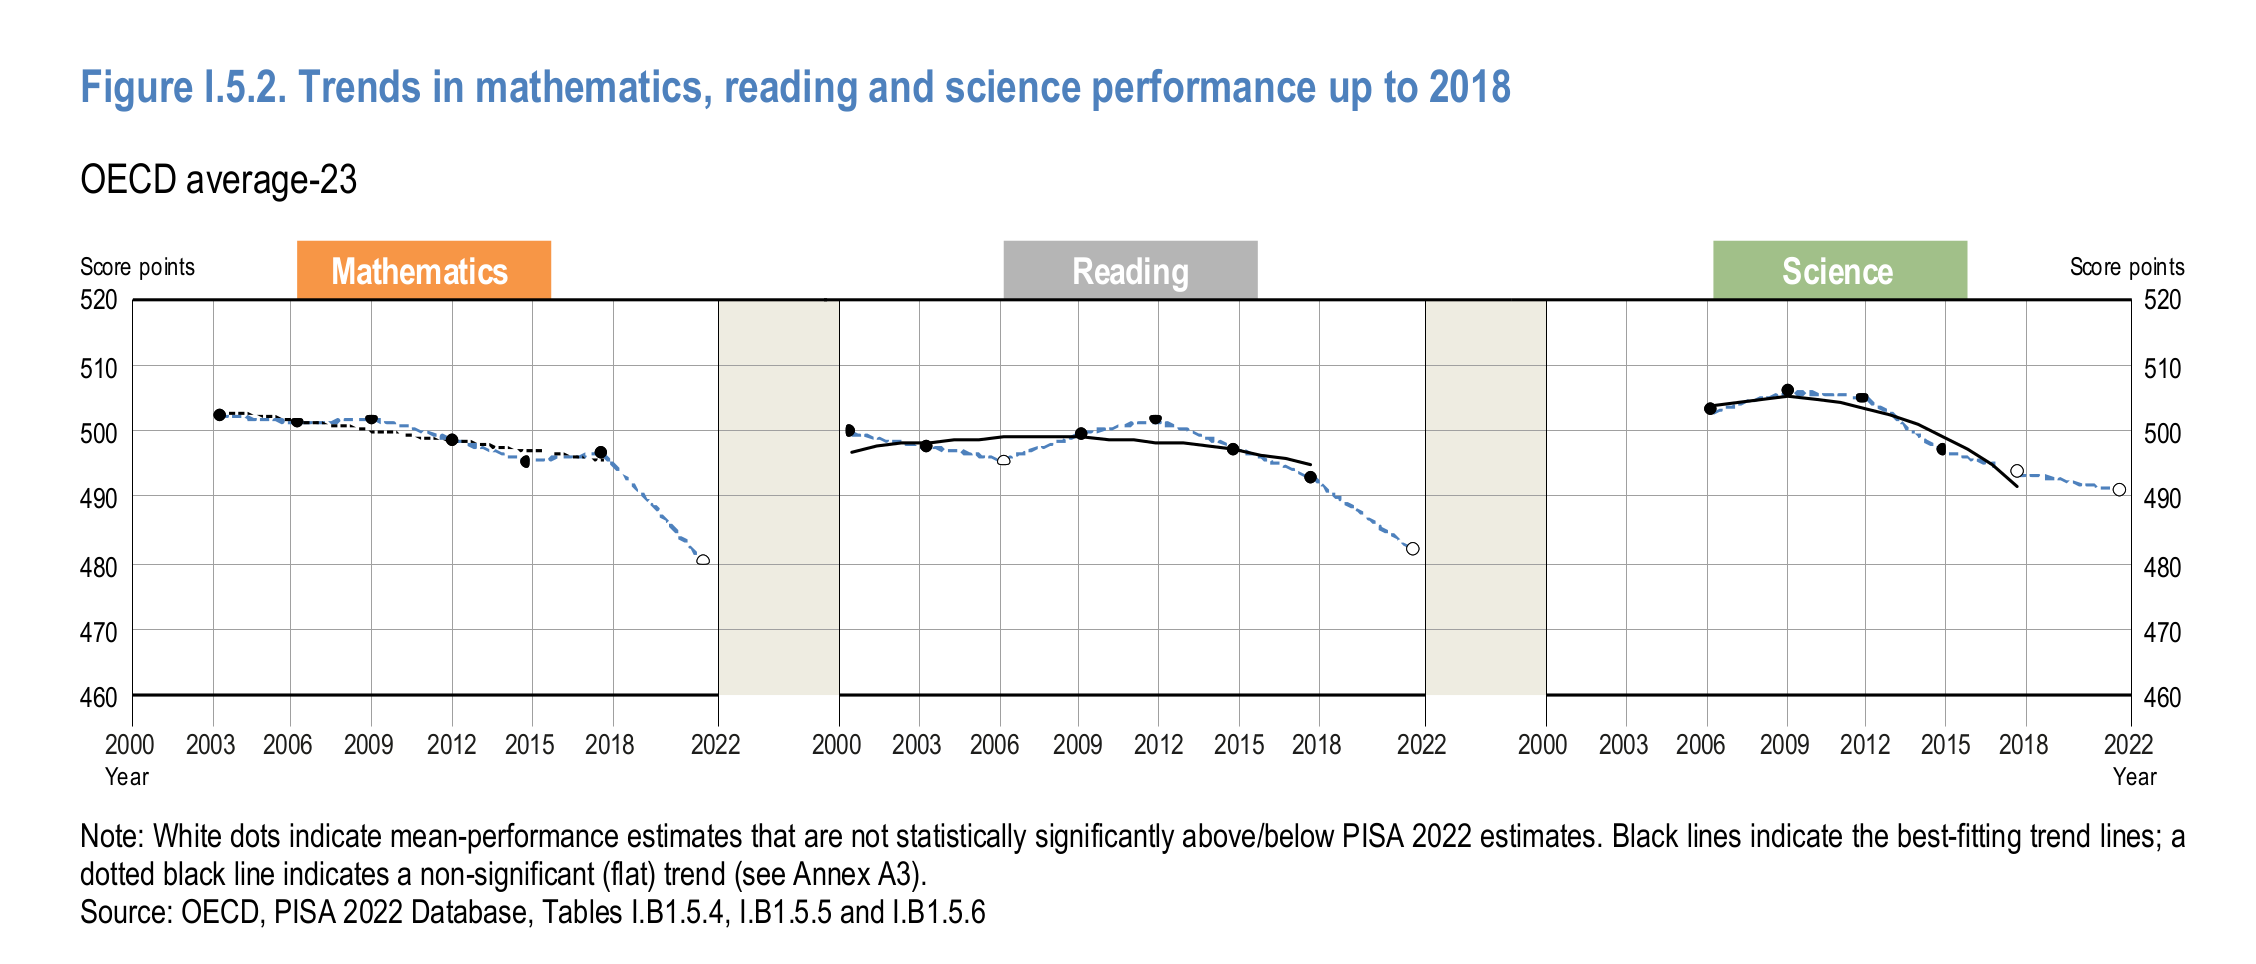
Note that math and reading show declines, but not science. That is curious isn’t it. Anything that affected general learning would also show an effect for science. As such, we are probably not looking for a general cause here since the effects are inconsistent with such a cause. Rather, we are looking for something that affected only those two tests. But even this conclusion is a simplification. Here’s the changes by country and test:
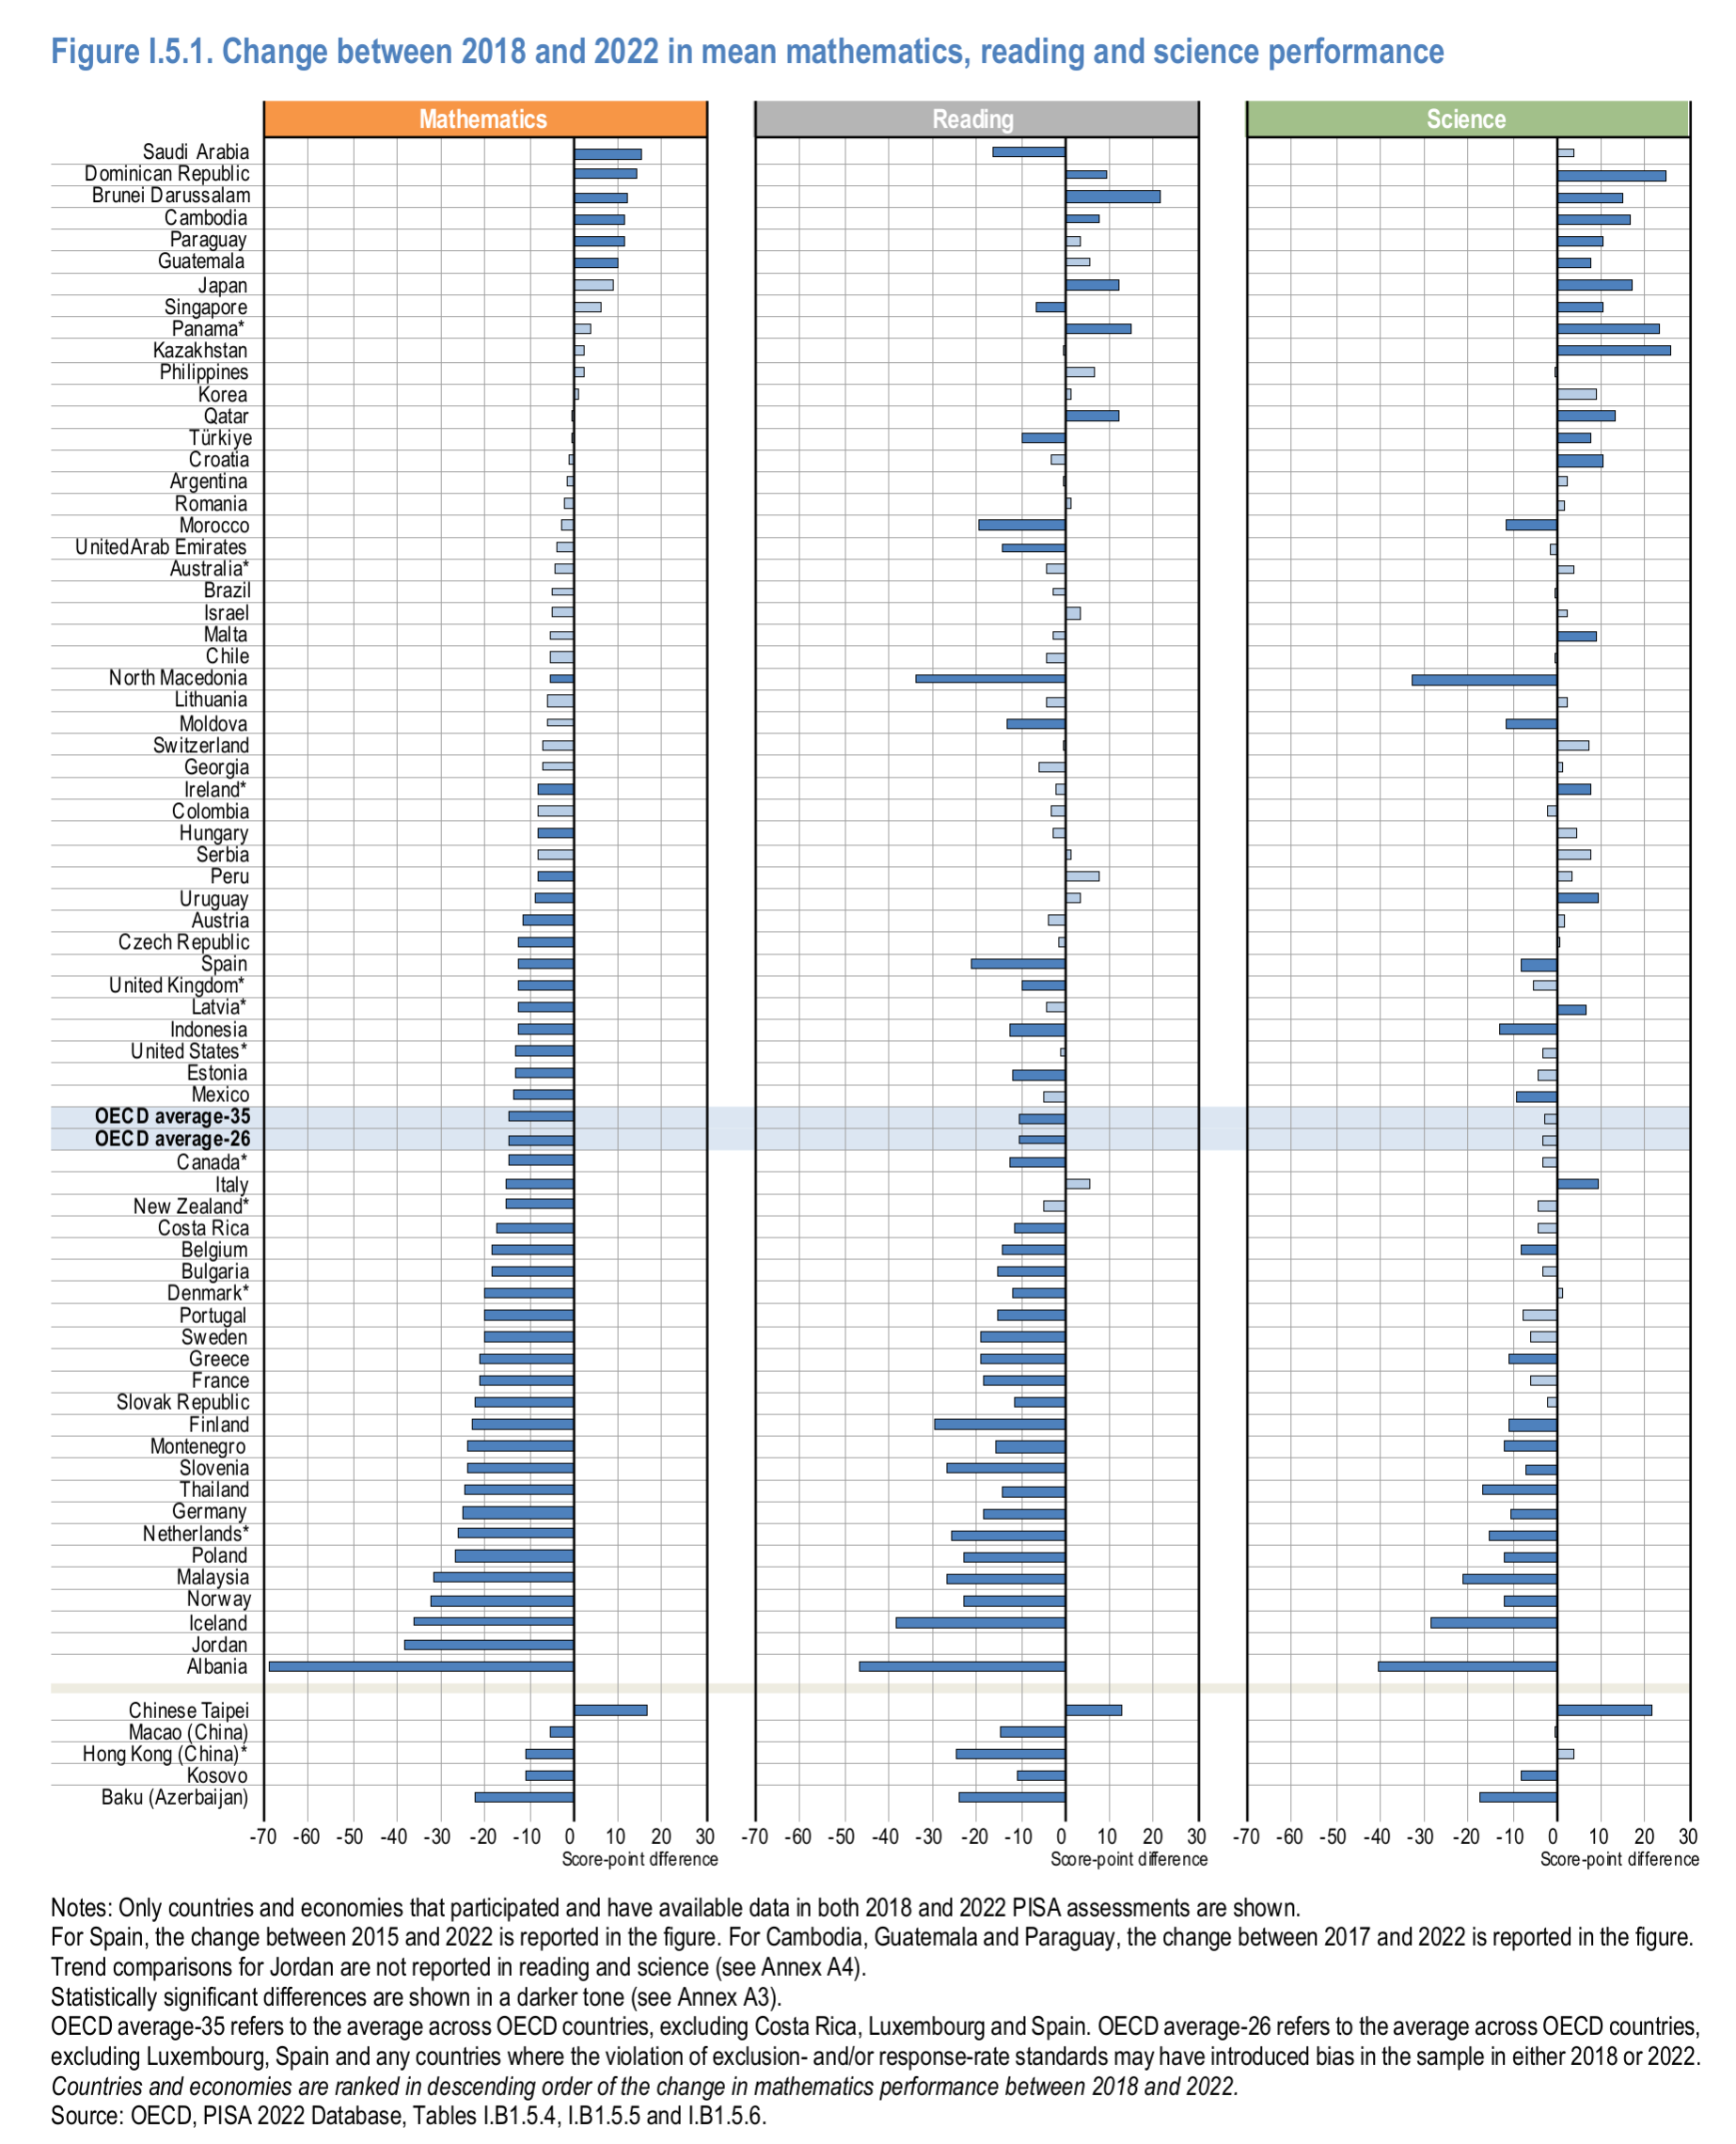
Maybe overall there is little change in science scores, but that’s because a bunch of 3rd world countries gained a lot of points in them (top right). In general, western countries also declined in science, just not so much as reading and math.
Anyway, sticking with the simple premise that reading and math showed declines but science didn’t. This could be the test format or the way the scores are linked. You see, the PISA 500 score is not the average of performance in OECD that year. If it was, the score would always be 500 and we can’t tell if students are getting better or worse (the same confusion some people have with national IQs, which are based on UK Whites as a reference). They instead use item response theory (IRT) methods to link scales across years by reusing some items and using them as anchors (everything is scaled to PISA 2000 average scores for selected countries, in theory). This is a good and standard method. The problem is this I think:
As was done in 2015 and 2018, computer-based tests were used in most countries and economies in PISA 2022, with assessments lasting a total of two hours for each student. In mathematics and reading, a multi‐stage adaptive approach was applied in computer-based tests whereby students were assigned a block of test items based on their performance in preceding blocks.
They introduced a new computer-adaptive testing method for the exact same two scales that showed a big change in 2022. Nowhere do the reports discuss whether these two facts may have something to do with each other. They spend a lot of pages discussing their testing of the new methods. Honestly, it looks OK in general. However, I found this table of problem items:
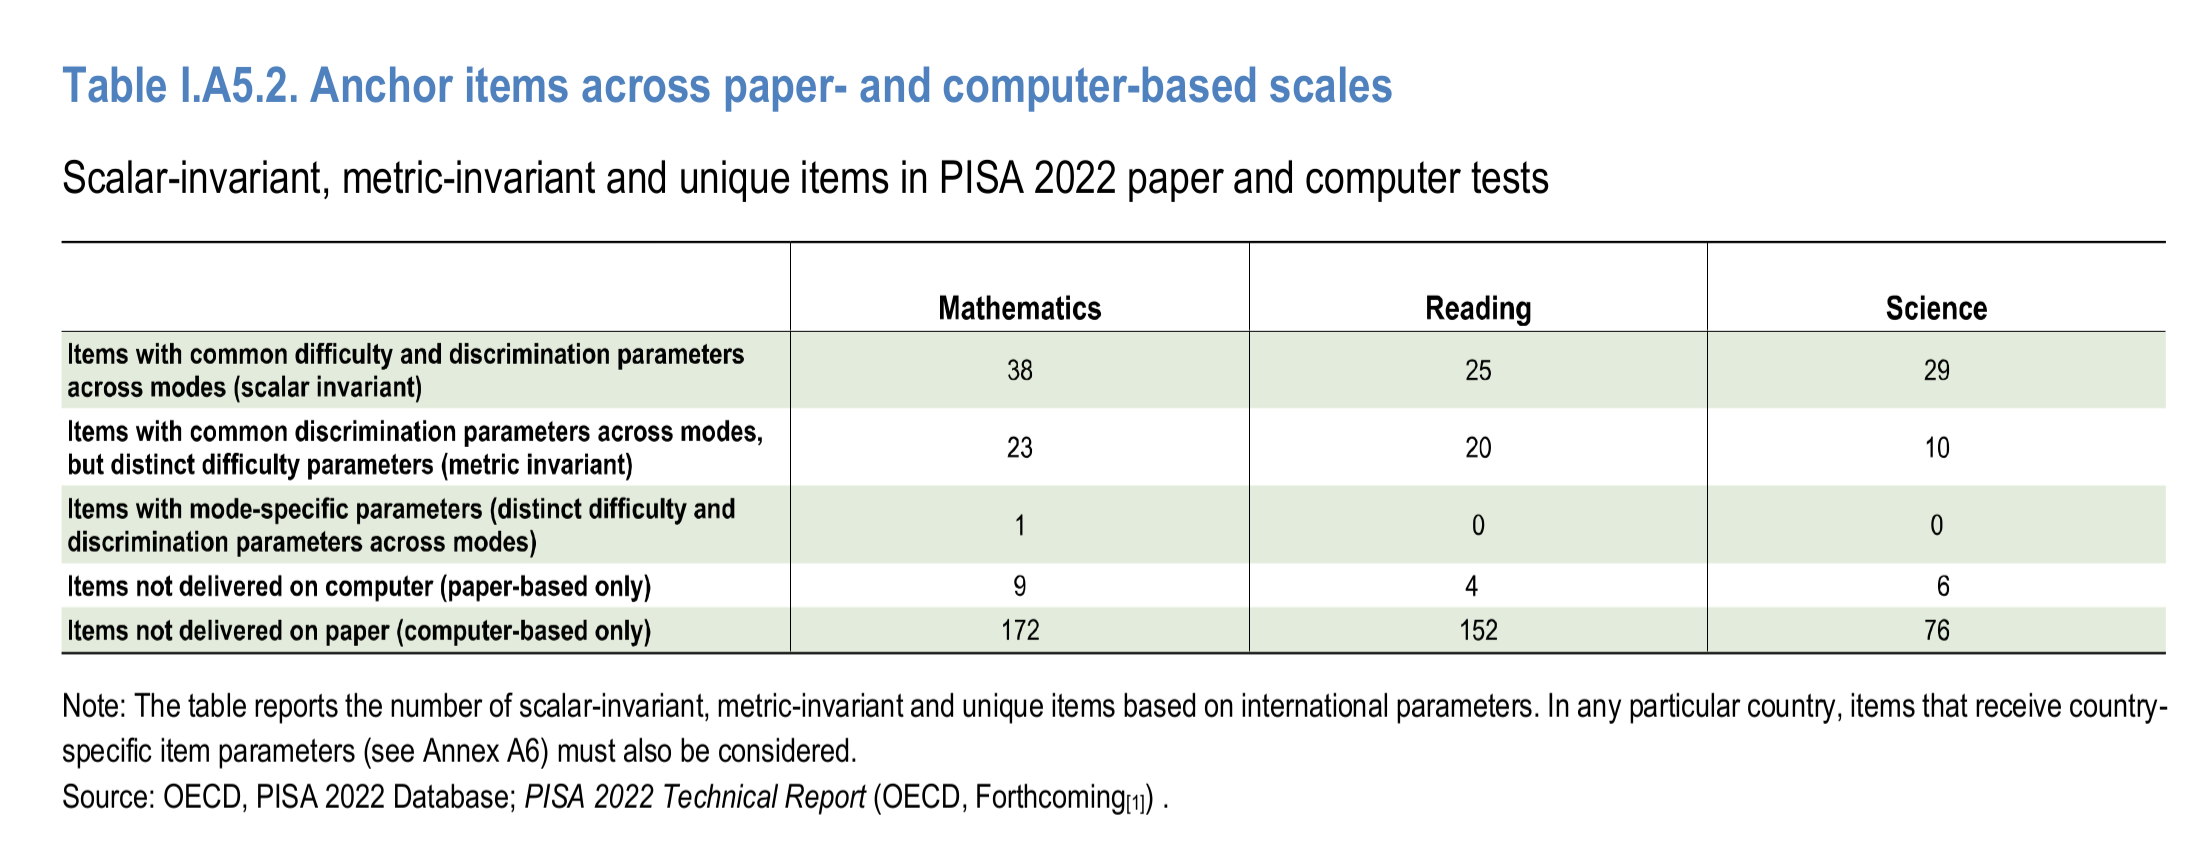
This is their differential item functioning (DIF) testing between paper and computer-based tests. Thus, in math 39% of items had issues, in reading 44%, but in science only 26%. This doesn’t seem like a coincidence either, as it is the same pattern as before. I don’t have time to do deep research on this, but I submit this this whole Big Decline business is, at least in part, an artifact of improper linking of the scales between years. It is pretty strange they don’t consider this option in 1000 pages. They have an entire chapter (5) in the main report about the 2018-2022 changes, but it doesn’t discuss this linking issue (but it spends numerous pages on whether boys now do slight better than girls in this or that country, yawn). Pretty strange!
We can also note several other problems that make us doubt whatever is going on. 2022 had a lot of student exclusions, even among good countries:
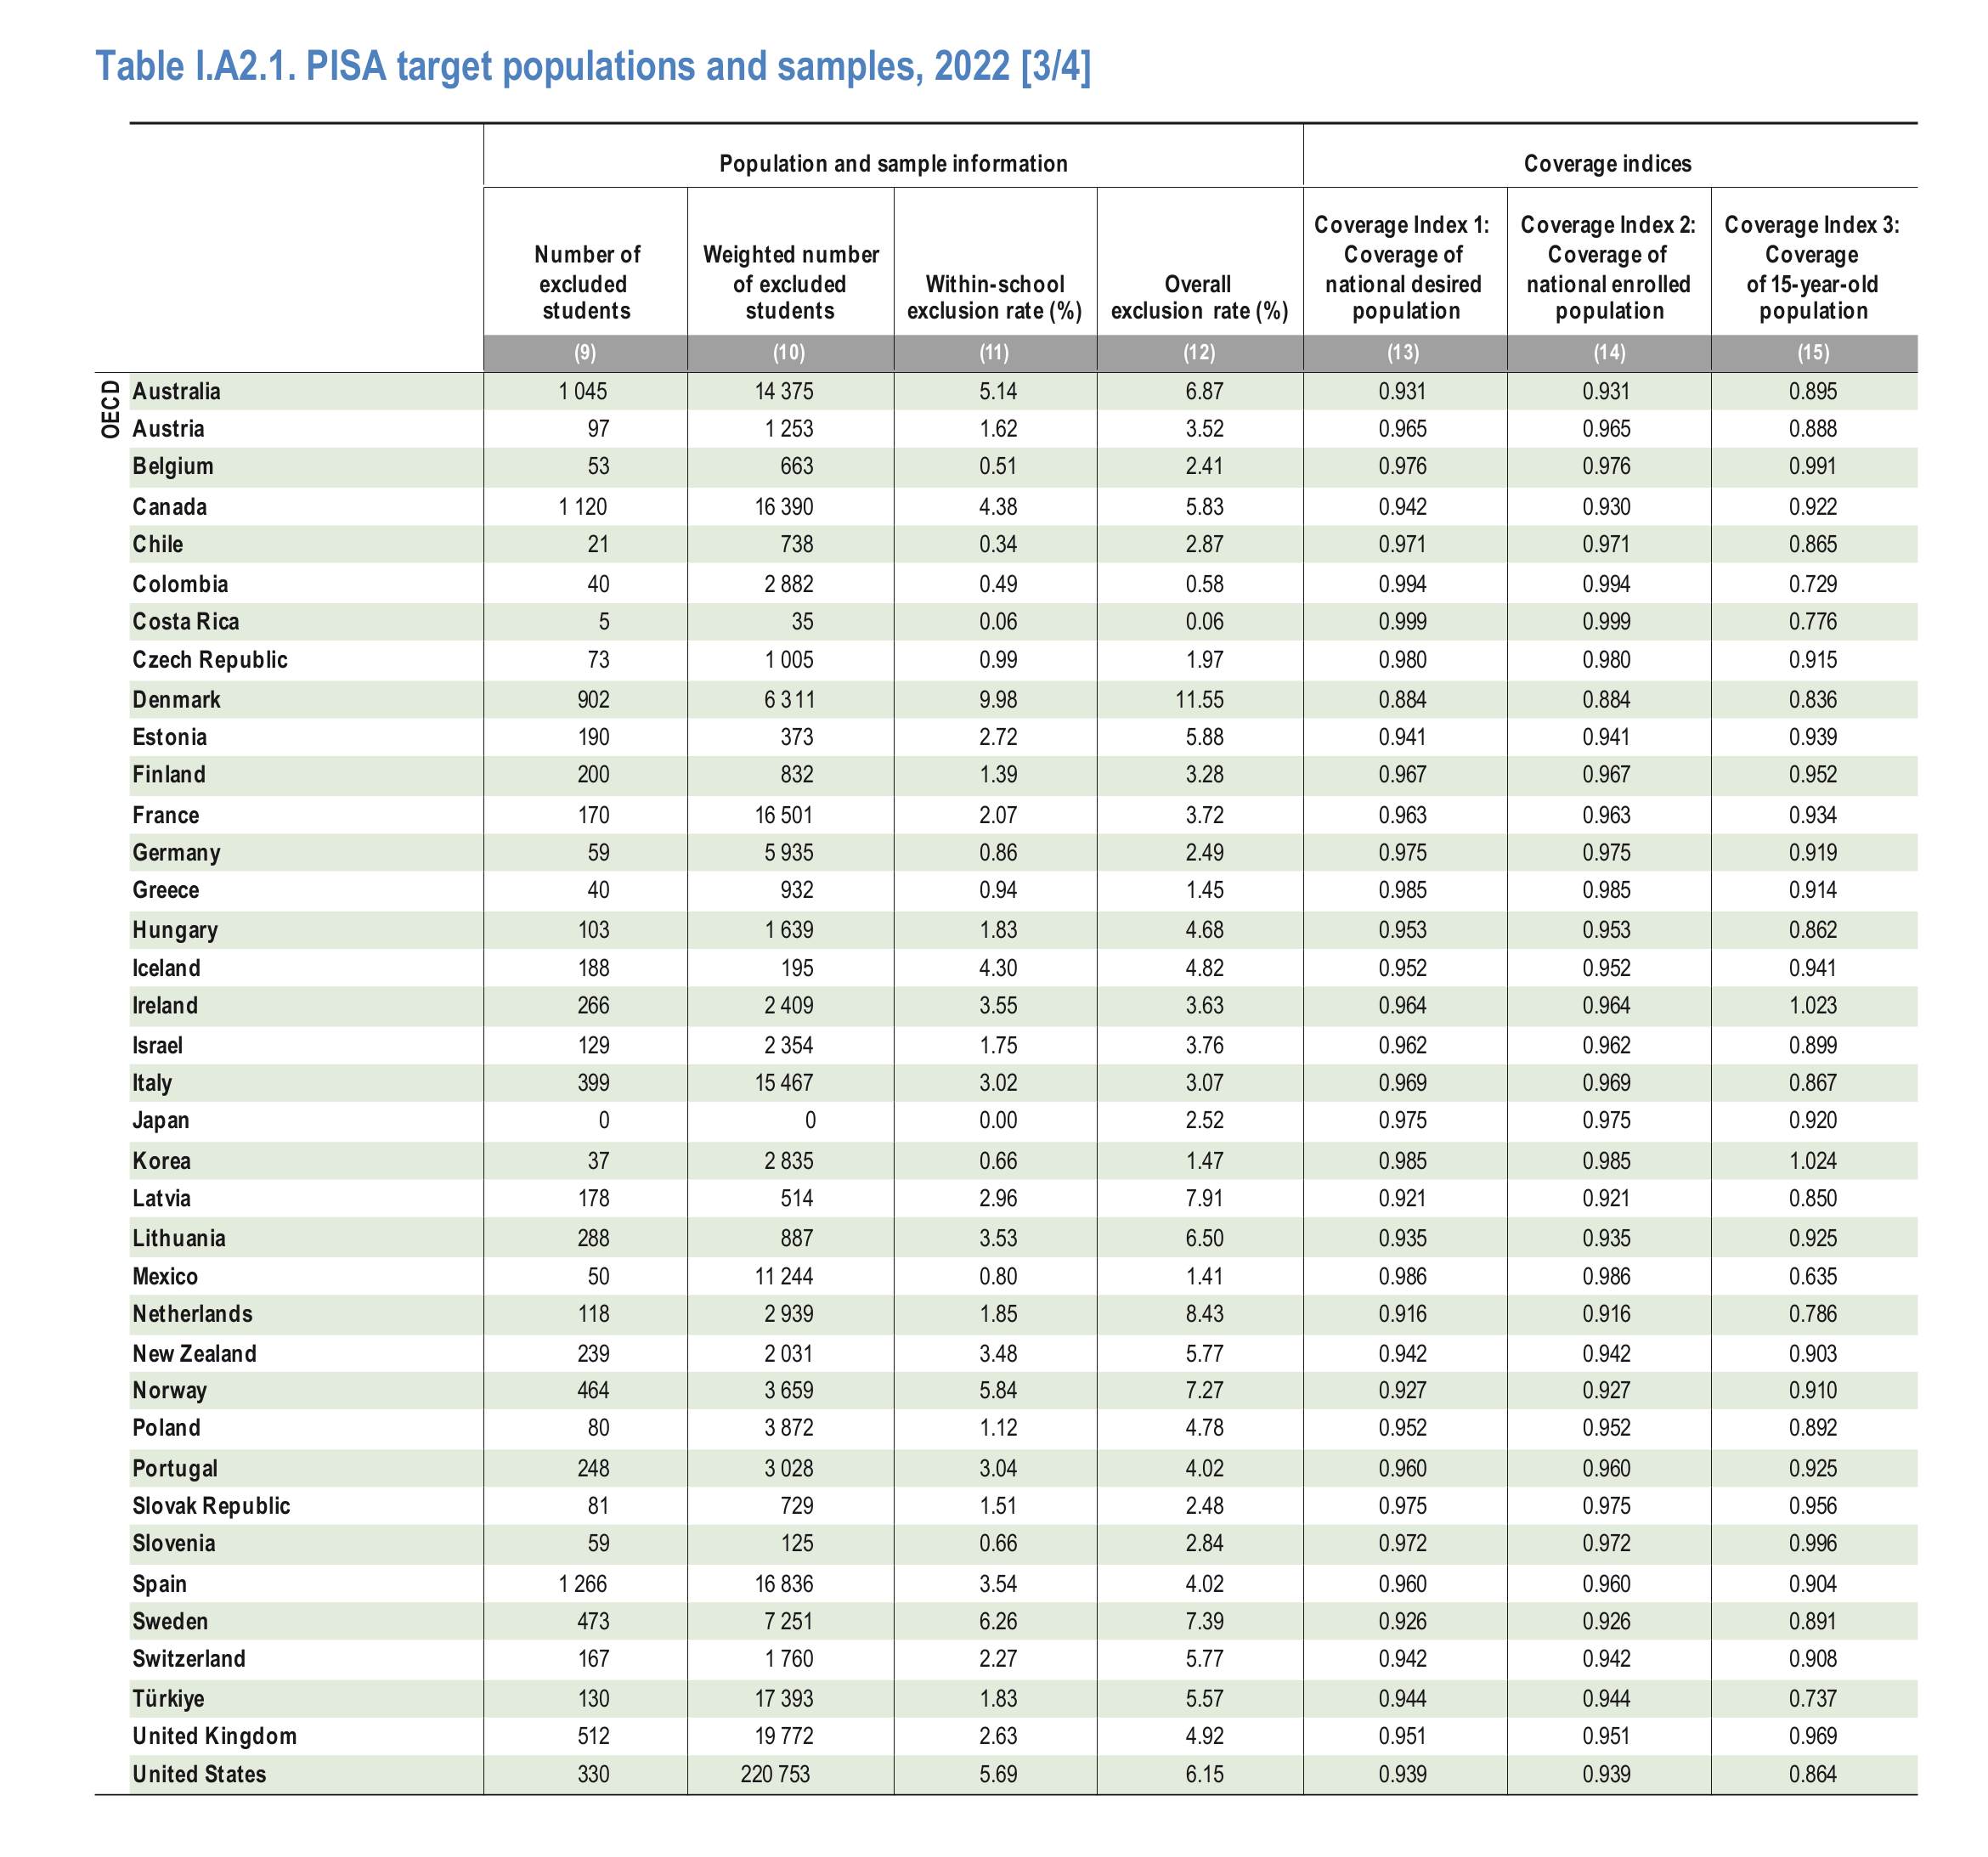
It is possible that one could work out if these differences are related to the changes in performance by correlating the score changes to these various exclusion metrics. Exercise left for the reader.
While skimming the reports, I also found some other juicy things to note. First, variability and average performance:
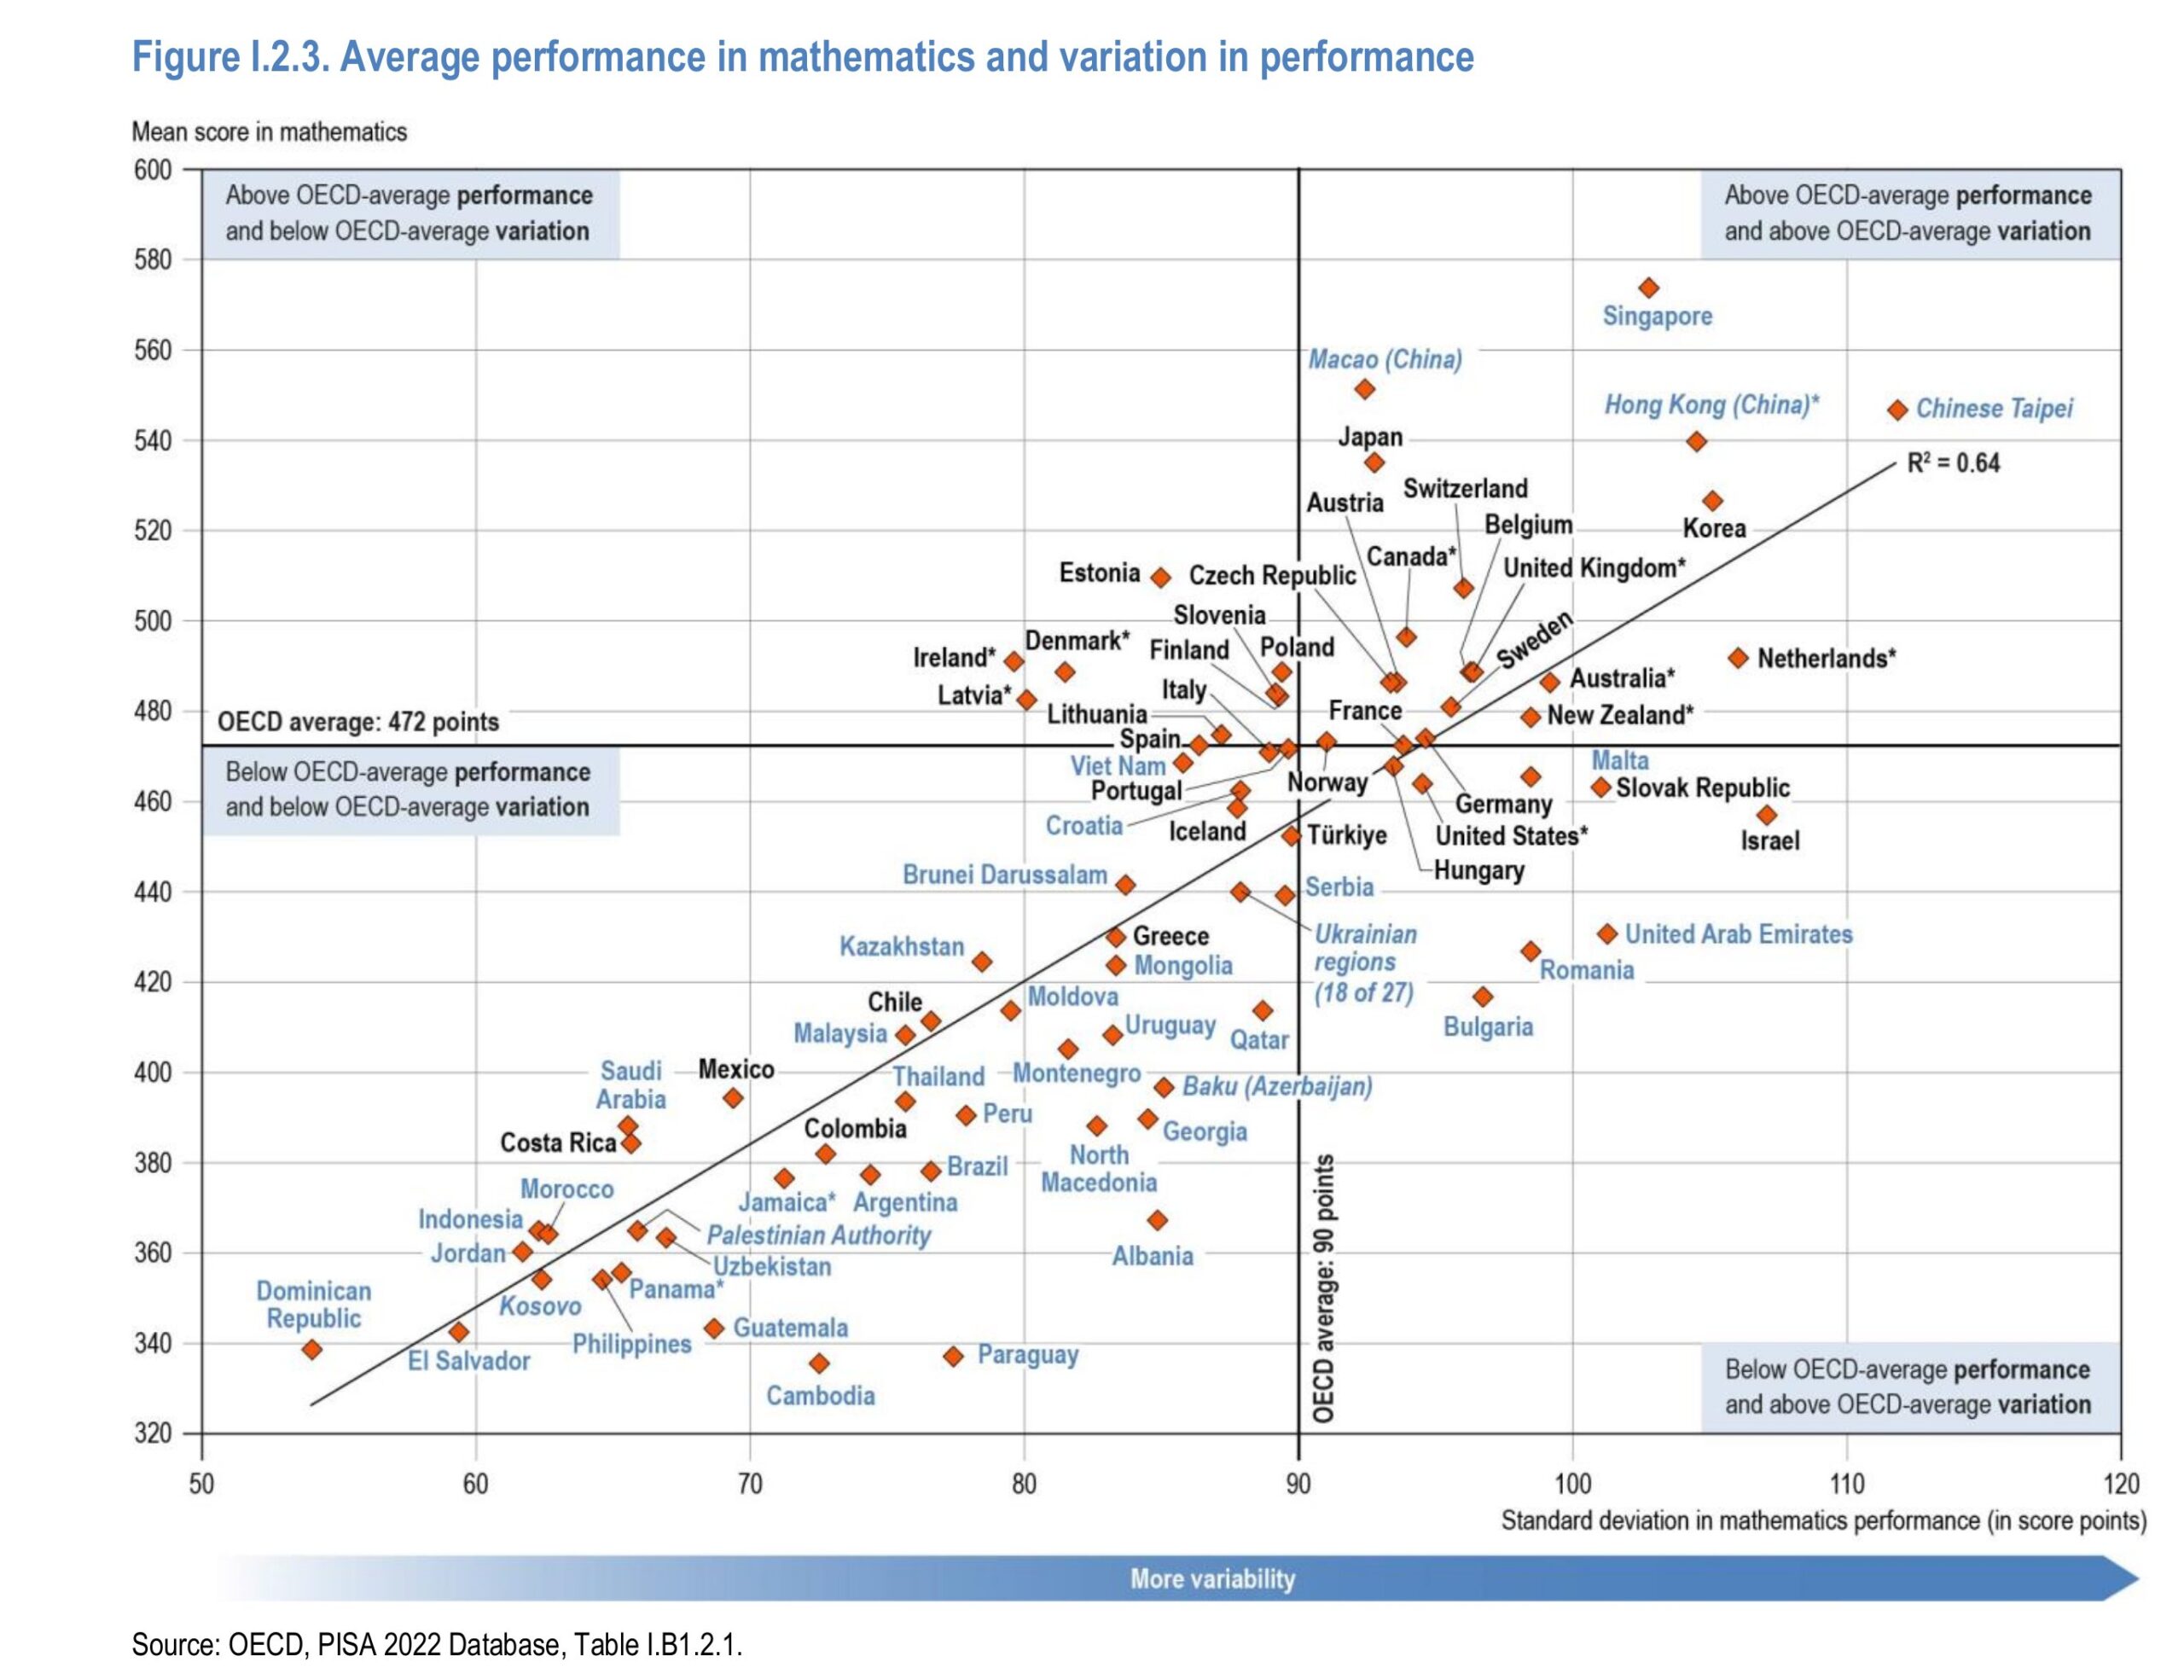
So it turns out that the countries with larger inter-student differences (here in standard deviations) are also those with higher average scores. This sounds like what one would get by not following their equity agenda and instead spending some resources on gifted education (and less on remedial/special education). This relationship between variability and means has also been noted for sex differences by Inquisitive Bird.
Second, ‘socioeconomic fairness’ and average performance:
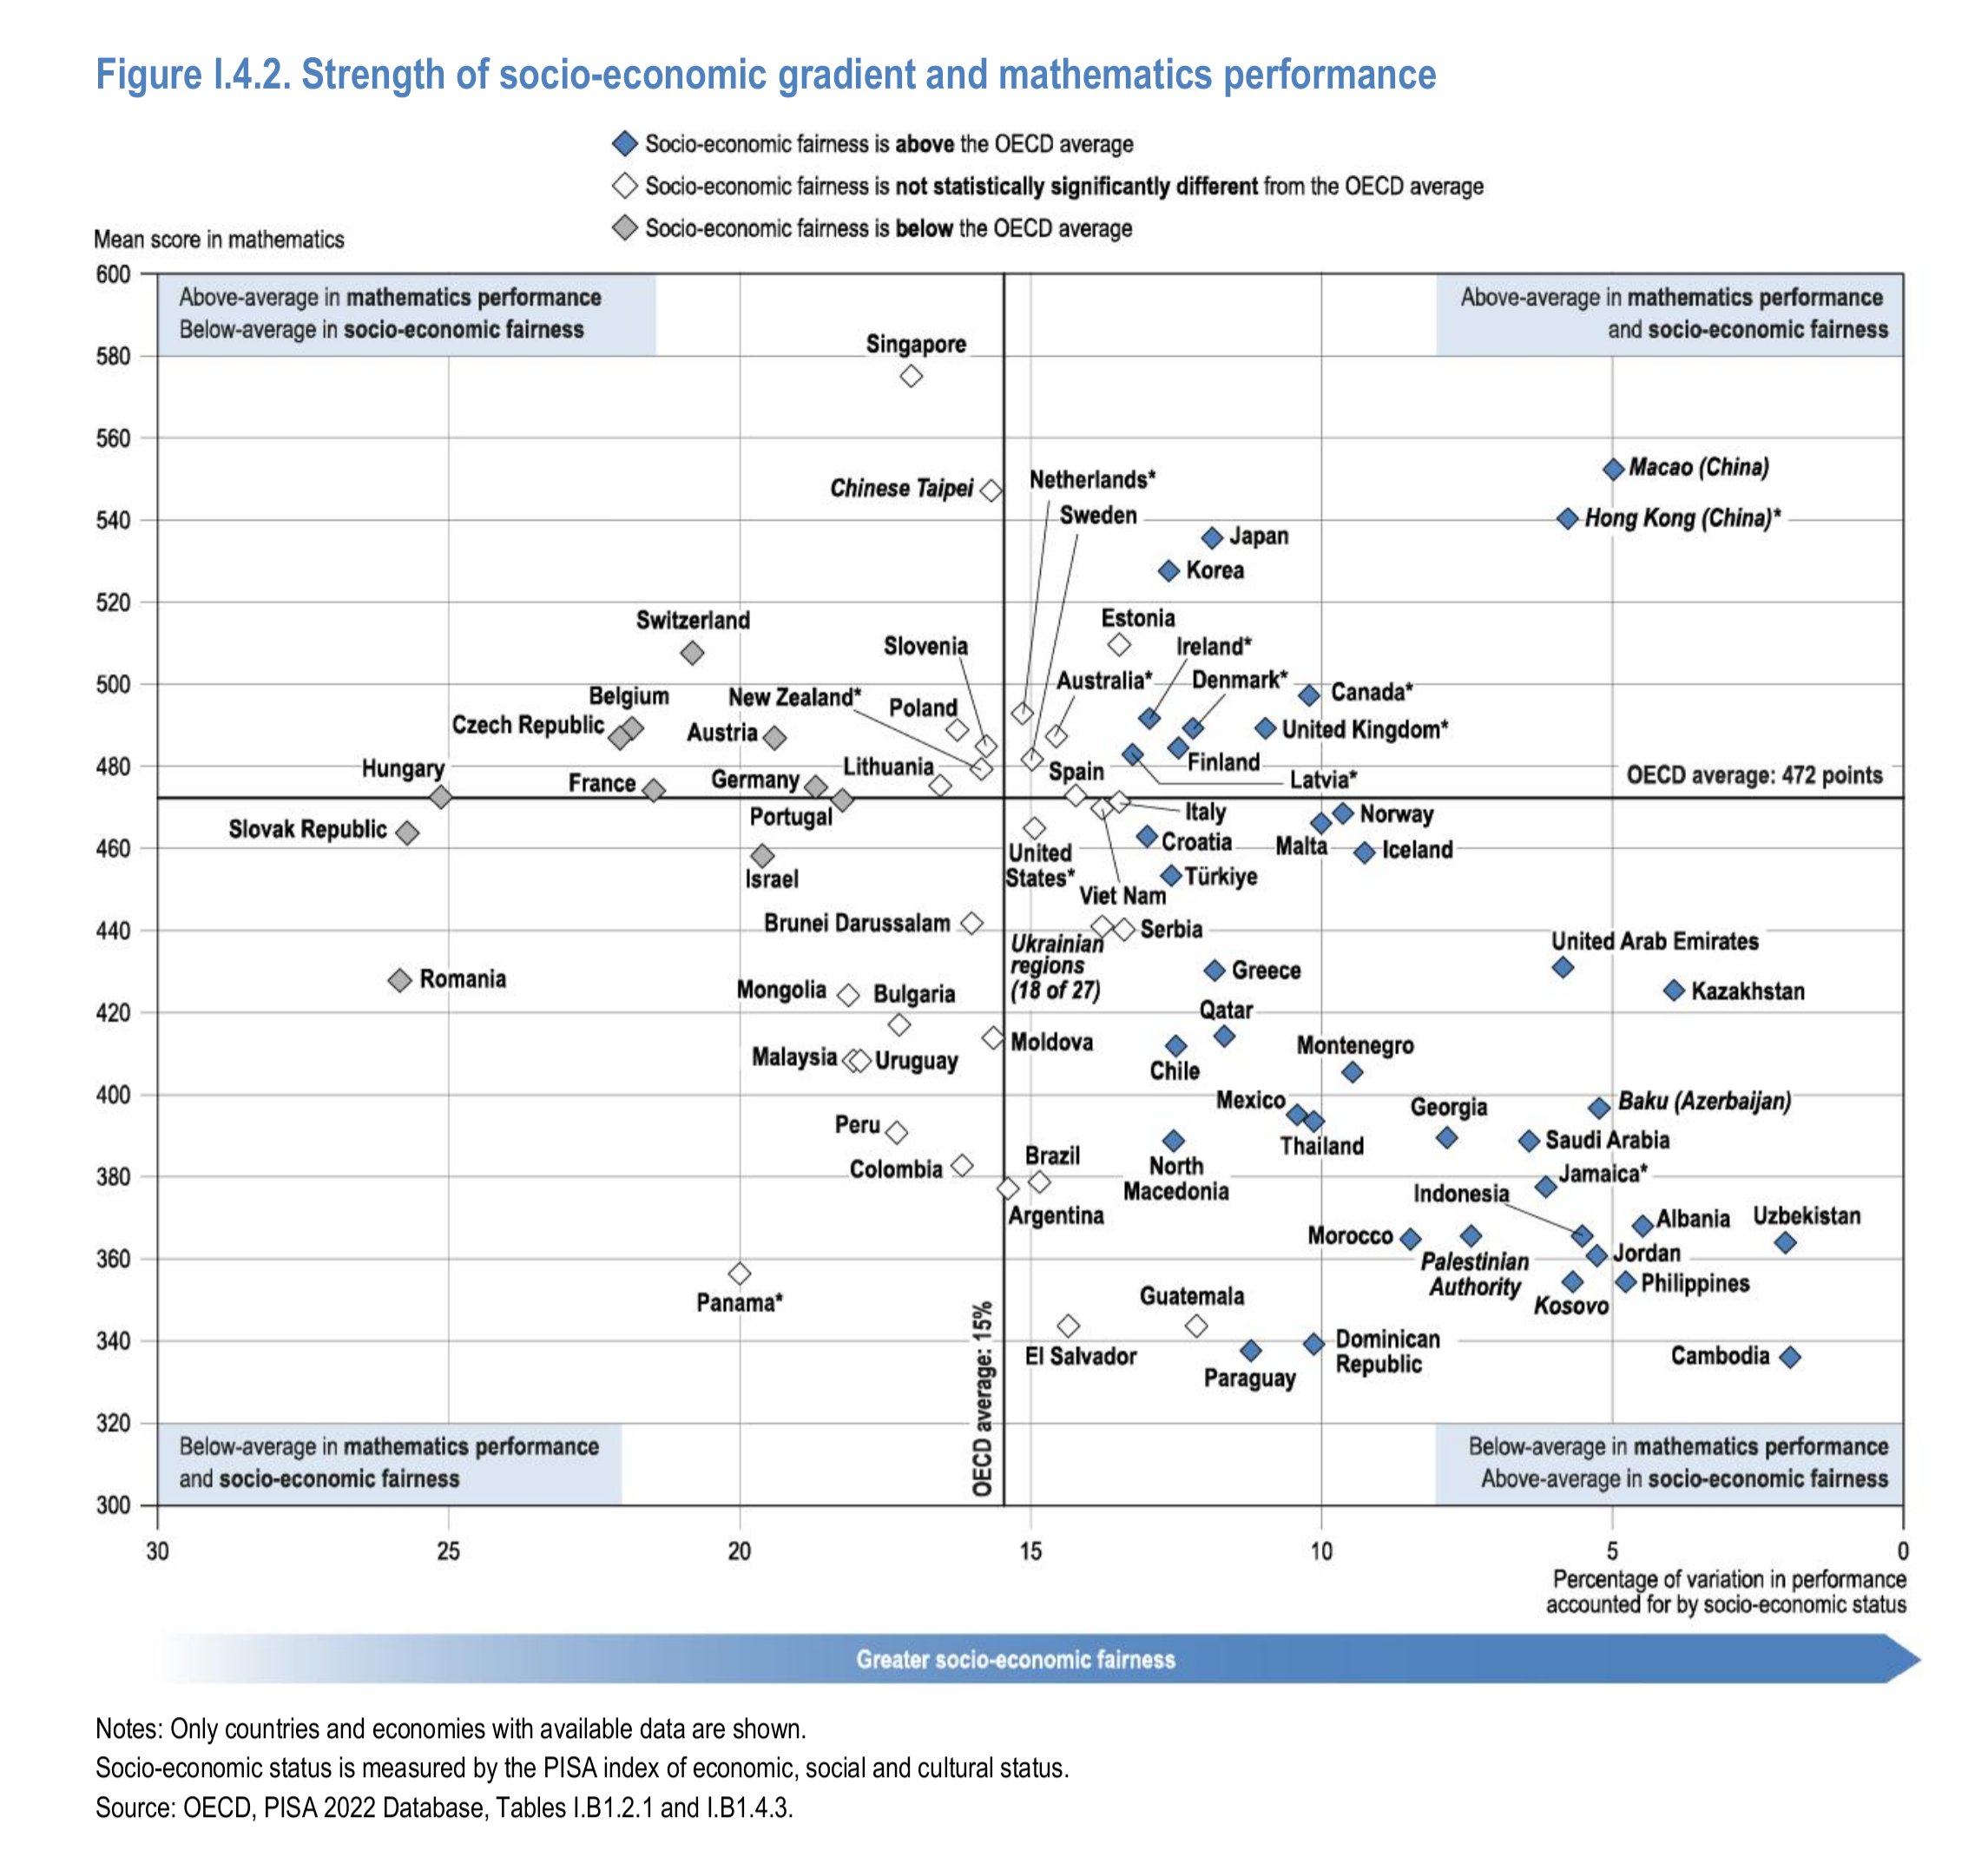
The PISA authors have a blank slate view of everything. In fact, their approach could be more precisely classified as a kind of social determinism where teachers, schools, and vague socioeconomic inequalities are the cause of every difference and this is Bad and Must Be Fixed. So naturally they are very interested in whether parental socioeconomic status (an index based on many questions about parents’ jobs etc.) predict children’s scores equally well across countries. They find that this is not the case. The naughty countries are thus labelled as being low in ‘fairness’. The problem for them here is that fairness is related to poor performance in general! As they themselves write “countries and economies with higher levels of fairness by socioeconomic status are not often those with strong student performance”.
Third, age-related comparisons:
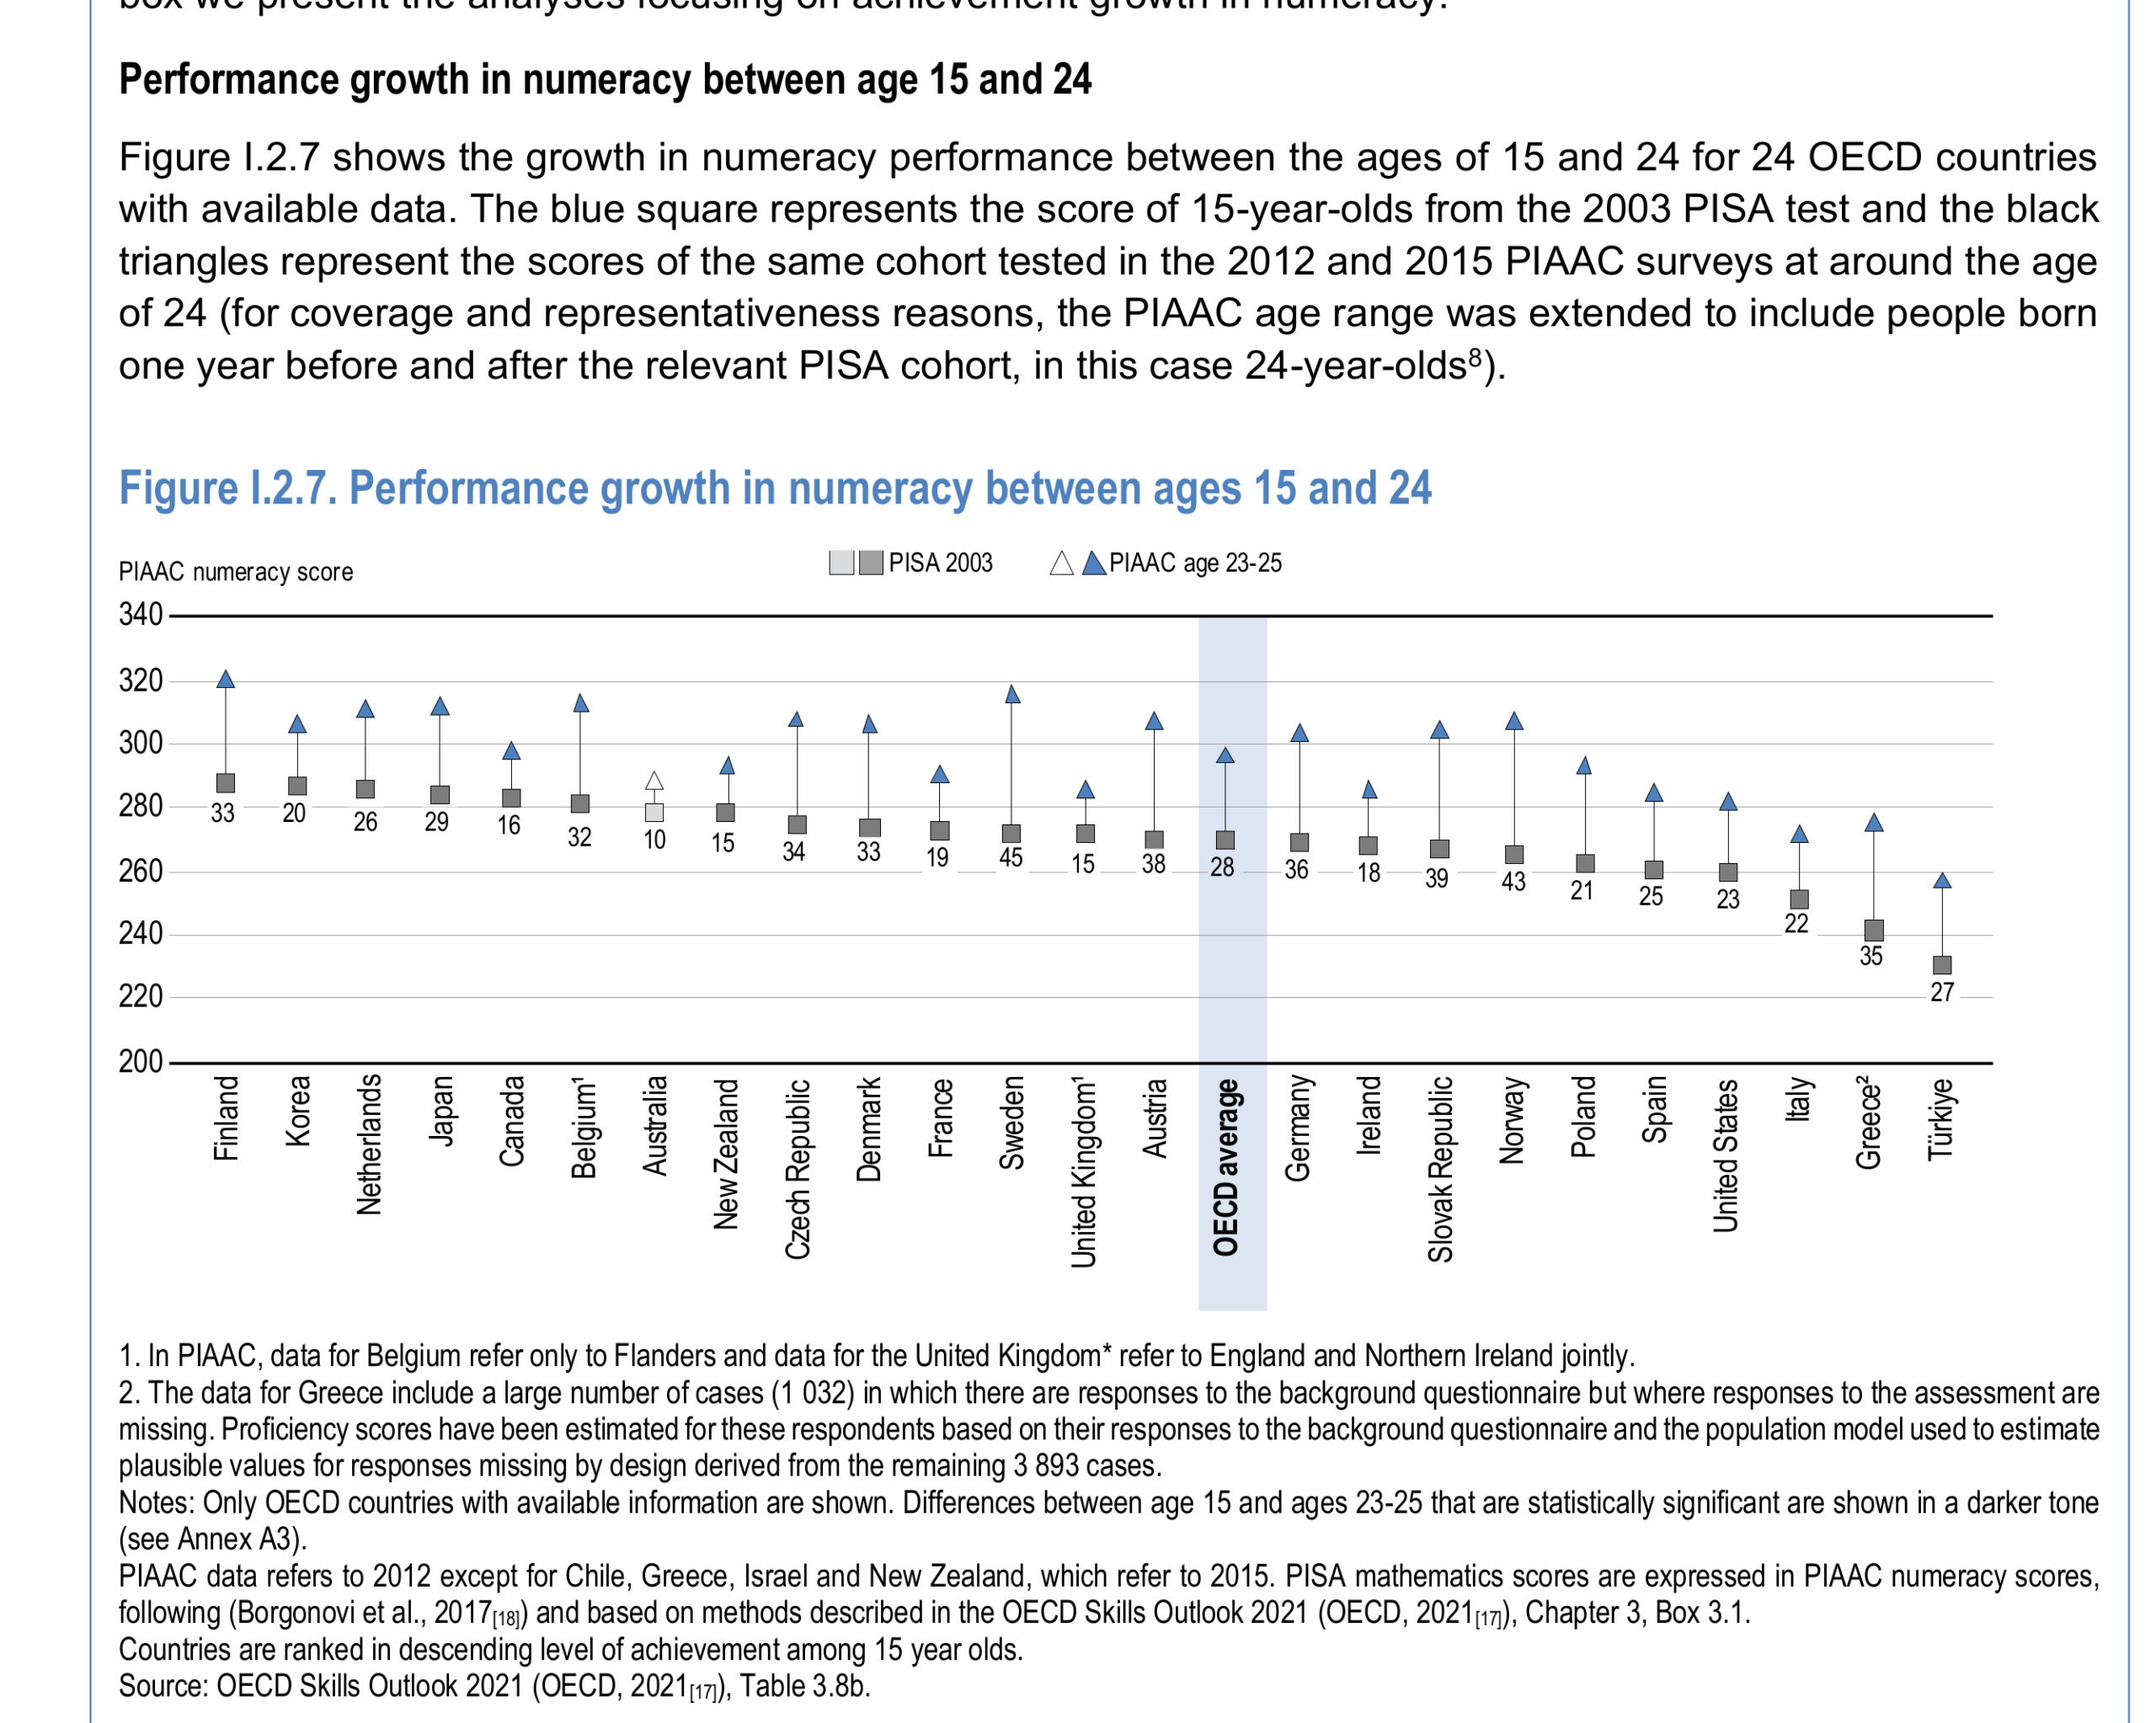
By linking the PISA scales to the adult equivalents (PIAAC), one can see the across-age performance differences. So here we can see that Turkish adults (age 24) perform as well as American and Spanish 15 year olds and worse than all the other 15-year olds. This brings us back to the old idea of using mental ages to understand low IQs. Turkish adults are not retarded, however, they simply only reach a level of mathematics ability that is equivalent to 15 year olds in Spain, and say, 14 year olds in Denmark, and perhaps 12 year olds in South Korea. In a similar way, if we had data for Africans in Africa, their adults would correspond to even lower mental ages. They are not included here because they don’t participate in PISA and PIAAC, and Turkey is the only poor country that did so. Countries with very low average scores (say 70 IQ) have populations that are at the level of 10 year olds in Western countries concerning intelligence. They are not like countries full of people with Down syndrome or other defects.
Fourth, infinity subscales:
How many scales per domain? Assessing the dimensionality of PISA domains
PISA frameworks for mathematics, reading, and science assume that a single continuous scale can summarise performance in each domain for all countries. This assumption is incorporated in the item-response-theory model used in PISA. Violations of this assumption therefore result in model misfit, and can be assessed by inspecting fit indices.
After the field trial, initial estimates of model fit for each item, and for each country and language group, provide indications about the plausibility of the uni-dimensionality assumption and about the equivalence of scales across countries. These initial estimates are used to refine the item set used in each domain: problematic items are sometimes corrected (e.g. if a translation error is detected); and coding and scoring rules can be amended (e.g. to suppress a partial-credit score that affected coding reliability, or to combine responses to two or more items when the probability of a correct response to one question appears to depend on the correct answer to an earlier question).
Items can also be deleted after the field trial. Deletions are carefully balanced so that the set of retained items continues to provide a good balance of all aspects of the framework. After the main study, the estimates of model fit are mainly used to refine the scaling model (some limited changes to the scoring rules and item deletions can also be considered).
Despite the evidence in favour of a uni-dimensional scale for the “major” domain (i.e. mathematics in PISA 2022), PISA nevertheless provides multiple estimates of performance, in addition to the overall scale, through so-called “subscales”. Subscales represent different framework dimensions and provide a more nuanced picture ofperformance in a domain. Subscales within a domain are usually highly correlated across students (thus supporting the assumption that a coherent overall scale can be formed by combining items across subscales). Despite this high correlation, interesting differences in performance across subscales can often be observed at aggregate levels (across countries, across education systems within countries, or between boys and girls).
So PISA admits that trying to split up mathematics into a variety of subscales isn’t actually supported by their data. This is the same as we see when test makers keep adding more subtests and indexes to the Wechsler tests. The consumers (clinical psychologists) love subscales and indexes because they can be read like tea leaves.
Fifth, PISA spends 100+ pages provides country-level summaries, which look like this:
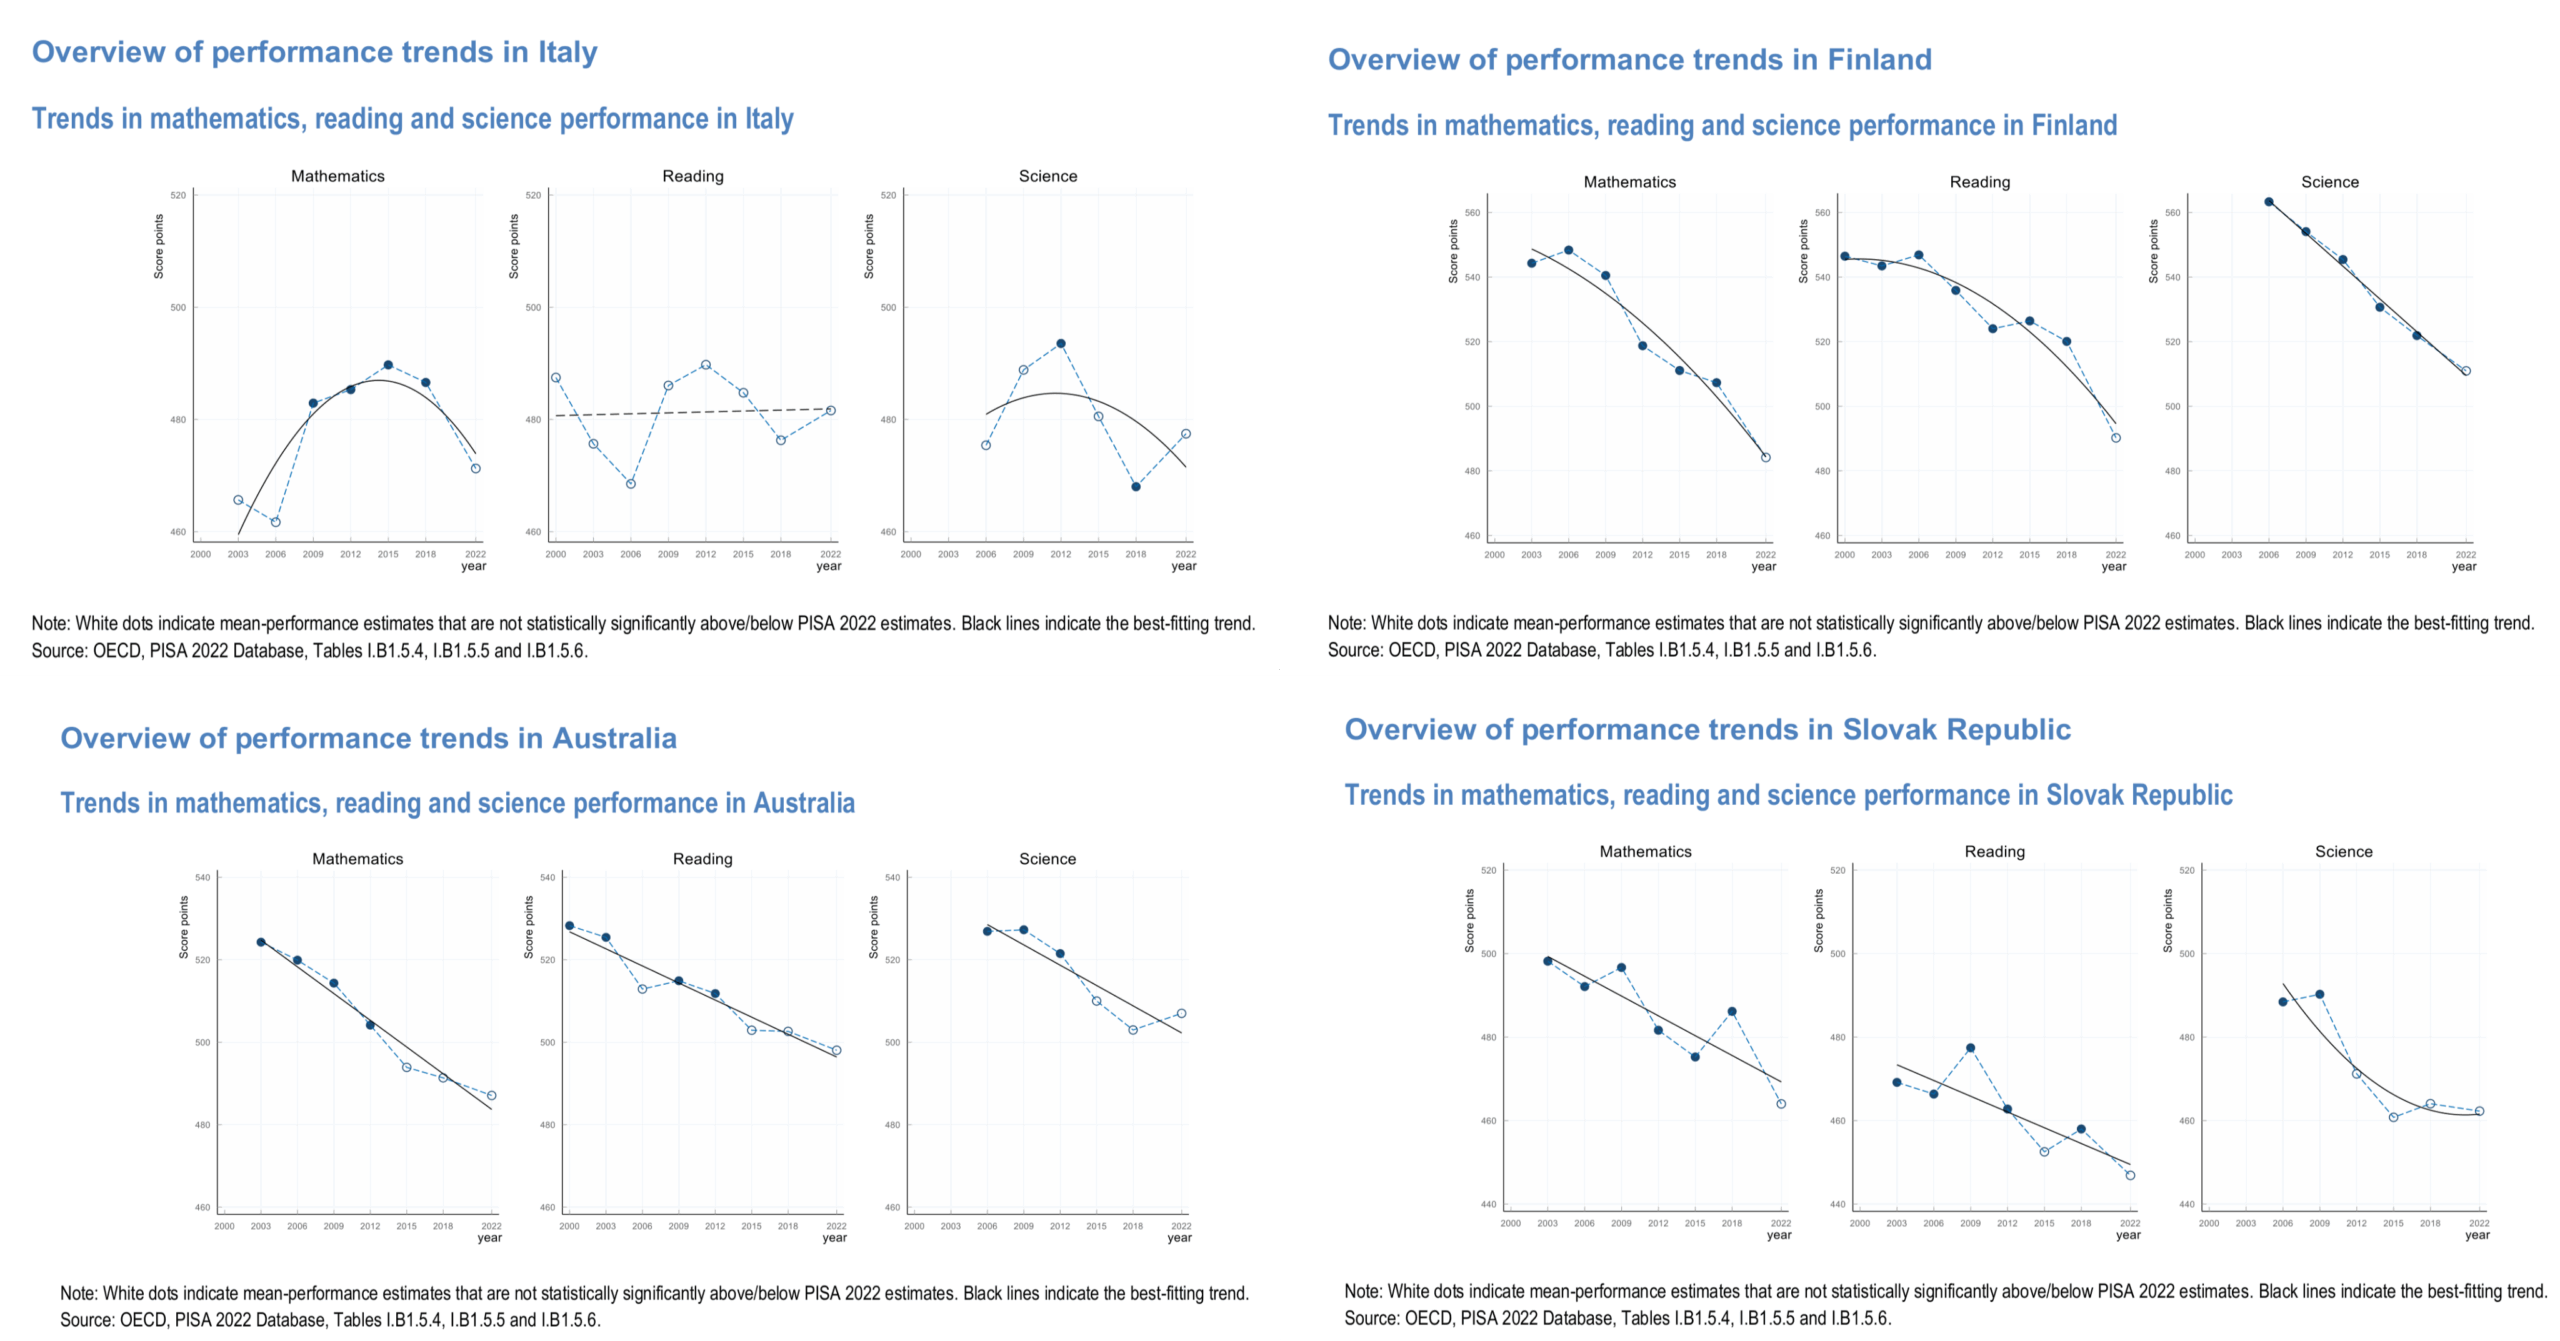
In general, Western countries show a decline which one might attribute to third worlders (Muslims and Africans mainly) increasing their share among of the 15 year olds. This is a simple explanation for a general decline trend which is grounded in known performance differences (the PISA report dunks on this because some third world and Asian countries have migrants that perform well, funny stuff). However, it fits sometimes (Australia, Finland), but not others (Italy, Slovakia). What gives? Well, for Slovakia maybe the smarter people are leaving the country in line with the general brain draining of East Europe. I don’t know though. I have no idea what could explain Italy’s bizarre pattern. I would in general caution against trying to interpret trend skills for cognitive measurements, as the errors of measurement are probably generally larger than trend trends in most cases.
Conclusions:
- PISA 2022 shows a big decline for OECD countries since 2018.
- It is tempting to attribute this to COVID school closures/other disruptions, but evidence from national tests do not support this. Neither does the fact that the decline mainly shows up in math and reading, not so much in science.
- Maybe not coincidentally, PISA 2022 introduced a new computer adaptive testing approach to math and reading but not science.
- Also maybe not coincidentally math and reading items show the largest amount of bias in items.
- Also also maybe not coincidentally, PISA 2022 relied almost entirely on computer based testing as opposed to paper based testing.
- In general, to explain specific patterns, one must rely on specific explanations. General explanations (COVID-lockdown, additive phones, sampling issues, [your favorite hobbyhorse]) don’t work for specific patterns.