Our big project was finally published:
- Van Pelt, D., & Kirkegaard, E. O. (2026). Big Data, Deep Roots: Correlating Surname Genetic Ancestry and Socioeconomic Status across Millions of Americans. Comparative Sociology, 25(2), 239-280. https://doi.org/10.1163/15691330-bja10162
Genetic variation plays a significant role in shaping socioeconomic status. Conventional census racial categories (Black, White, Asian, Hispanic) obscure substantial variation among ancestry groups. Surnames reflect ancestral lineage and genetic heritage, enabling finer measurement. The authors combined 23andMe genetic ancestry data on surnames with surnames yielded from government financial records, criminal databases, Wikipedia entries, and physician licensure records. They found that genetic ancestry strongly predicted surname-level outcomes across all metrics, with substantial differences in social standing among ethnic groups. Ashkenazi Jews and Indians ranked highest; British/Irish and Iberian ranked lowest among Europeans; highly selected immigrant groups such as Arabs and Iranians scored above Europeans.
Ancestry-related social gaps are much researched in the USA. Most of the research focuses on the relatively crude racial categories of Black, White, Hispanic, Asian. But there is also some research on the more fine-grained differences. The origin of the study was that some people posted 23andme’s surname page on X. You can look up almost any surname found in the American population there to see statistics about it, including ancestry results from 23andme customers. For instance, looking up “Brown”, we can see that the mean ancestry for this group of customers is:
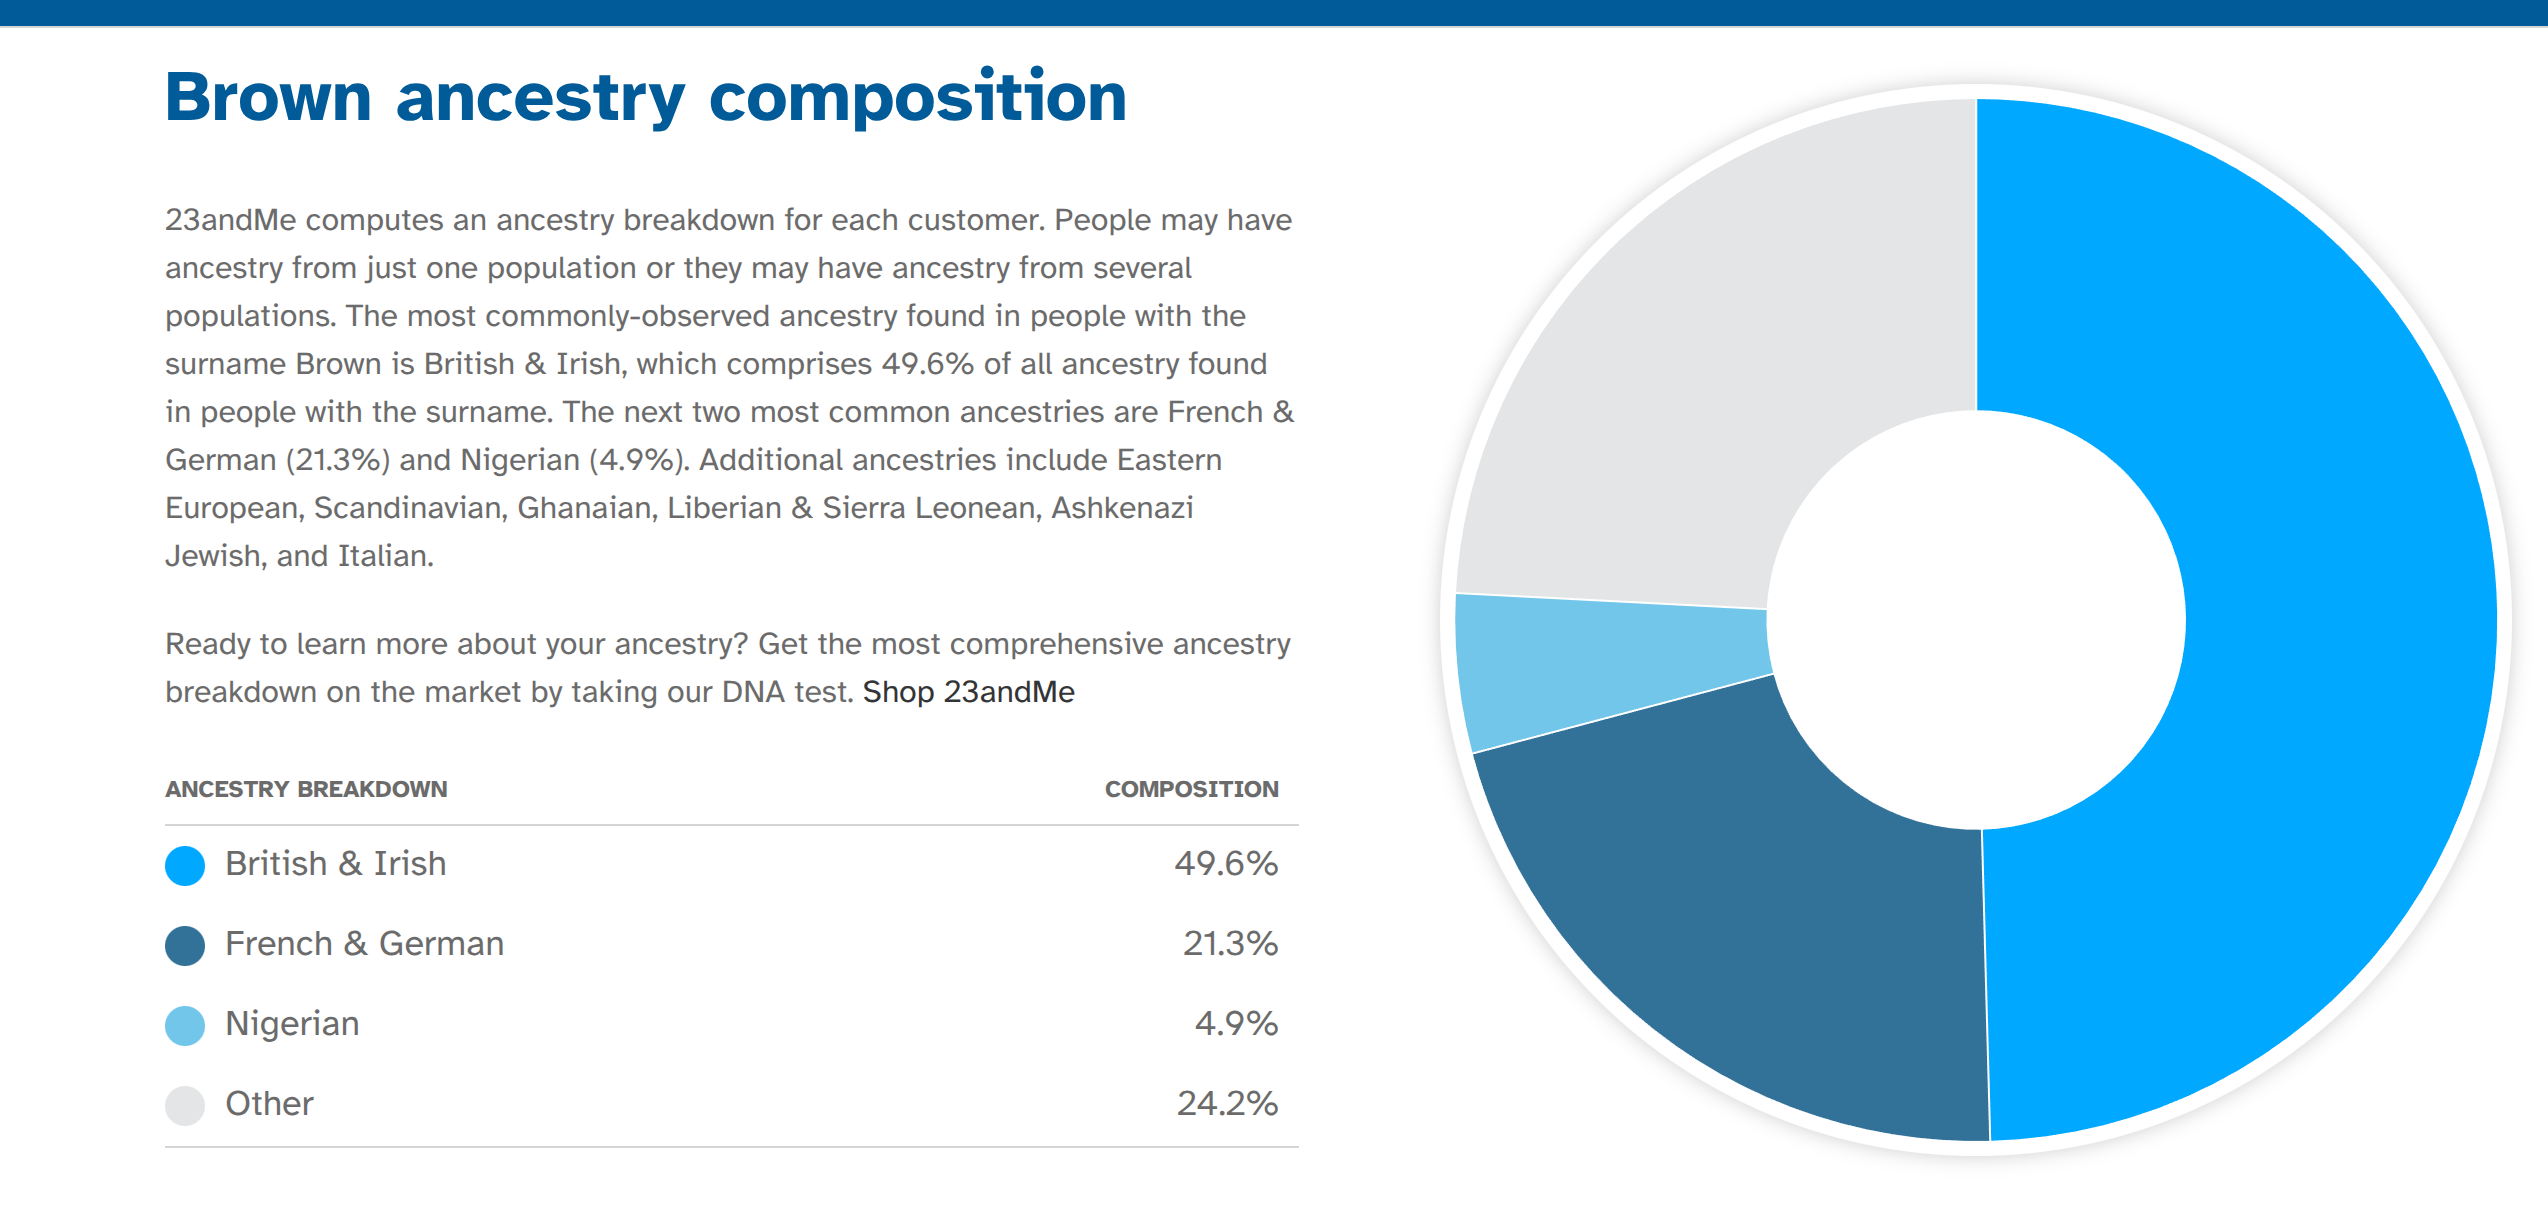
It’s about half Anglo, 20% French/German (for those who changed the spelling from the German equivalent, Braun), and a bit of Nigerian (in African Americans). A hefty 24% is “Other”, which is not very helpful. What is helpful is that 23andme does provide the full breakdown in the source code, so we can see that this 24% Other is actually Scandinavian 3.4%, Ashkenazi 2.7%, Chinese 0.3% etc. We scraped this data for all their names (~11k). Other data for surnames is kinda hard to come by so we had to resort to more scraping. Specifically:
- Mugshots from 39 American states
- Salary and occupations from 31 states and the federal government (public salary and job lists)
- Wikipedia mentions (intellectuals)
- Physicians’ licenses in 43 states
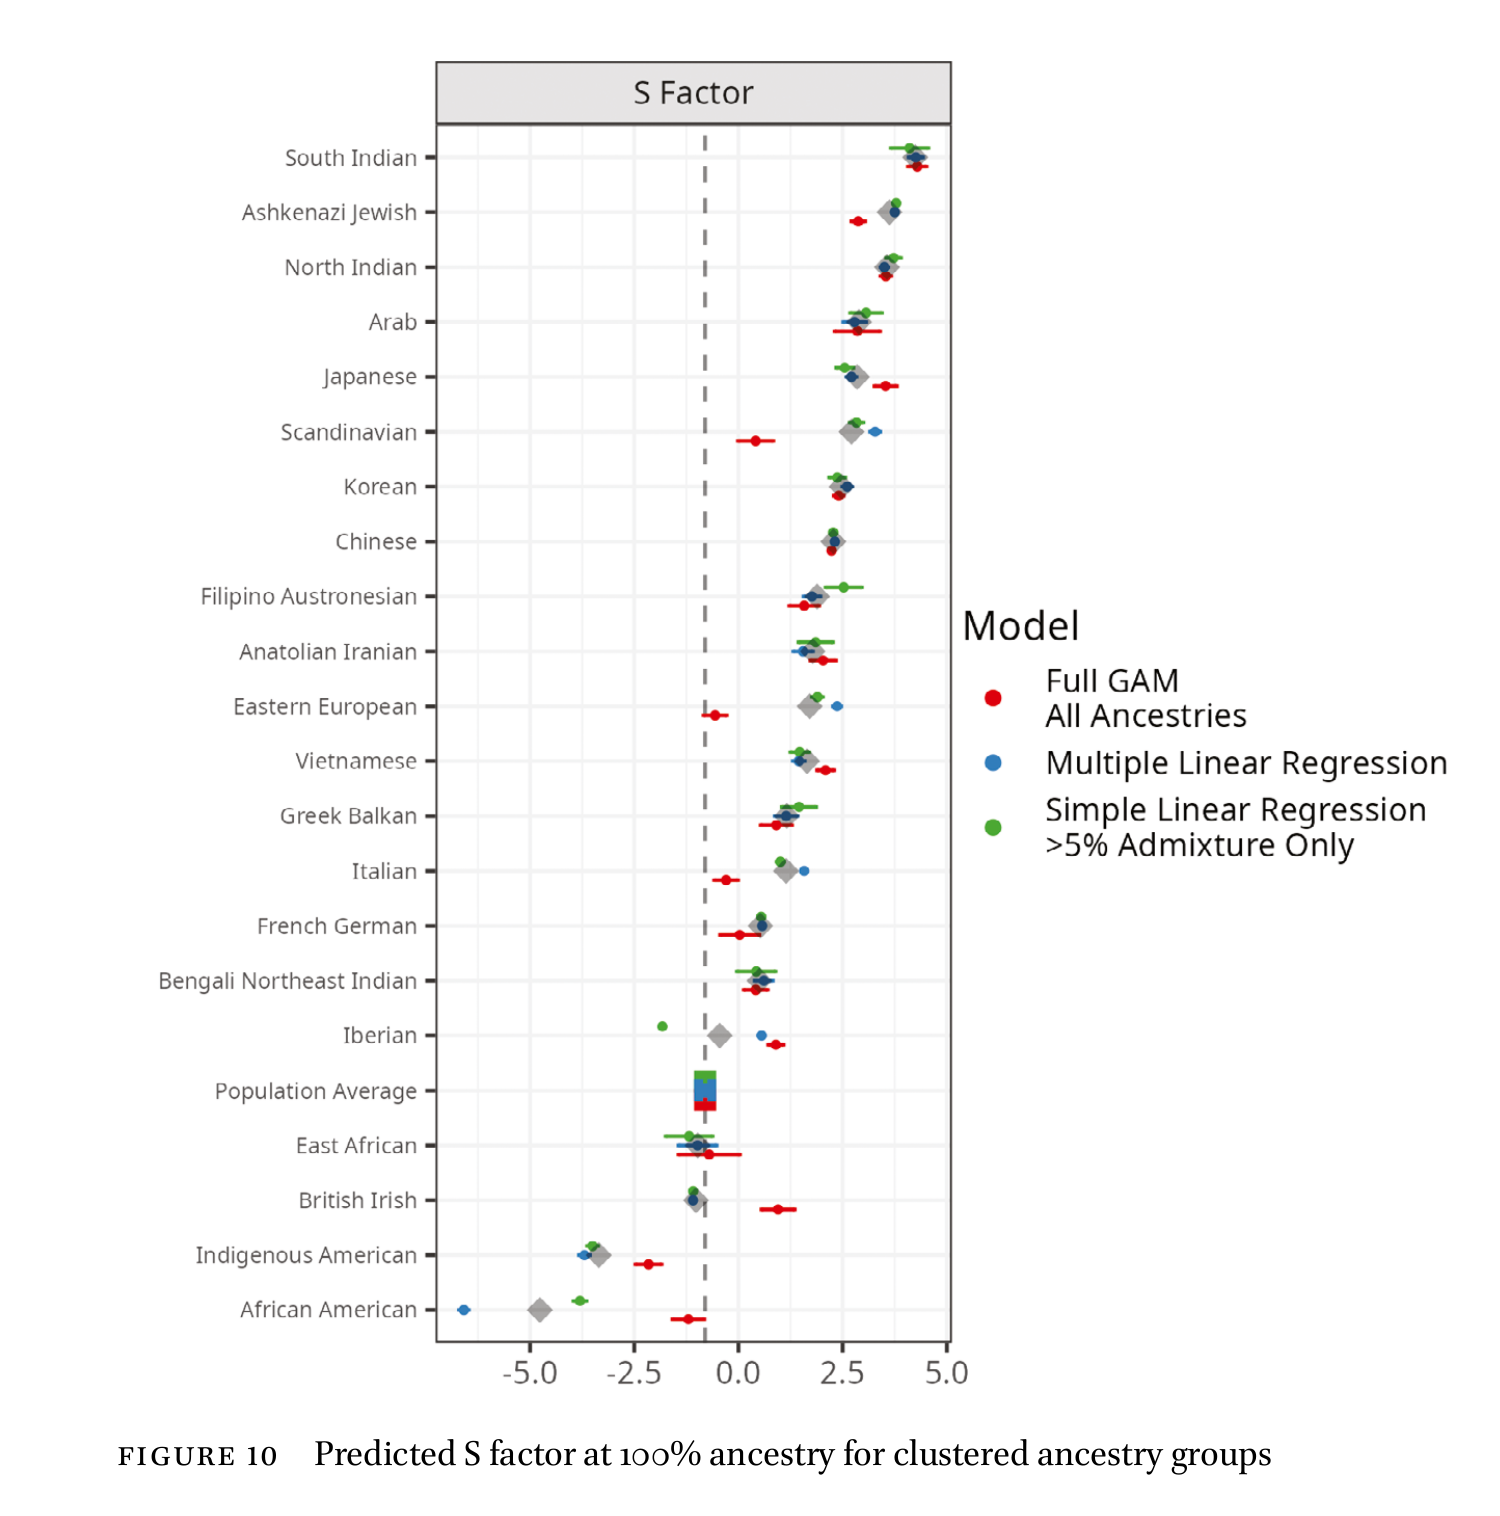
Combining these millions of records, it is possible to estimate a fairly decent general social status, or S factor, for each surname based on these correlations:
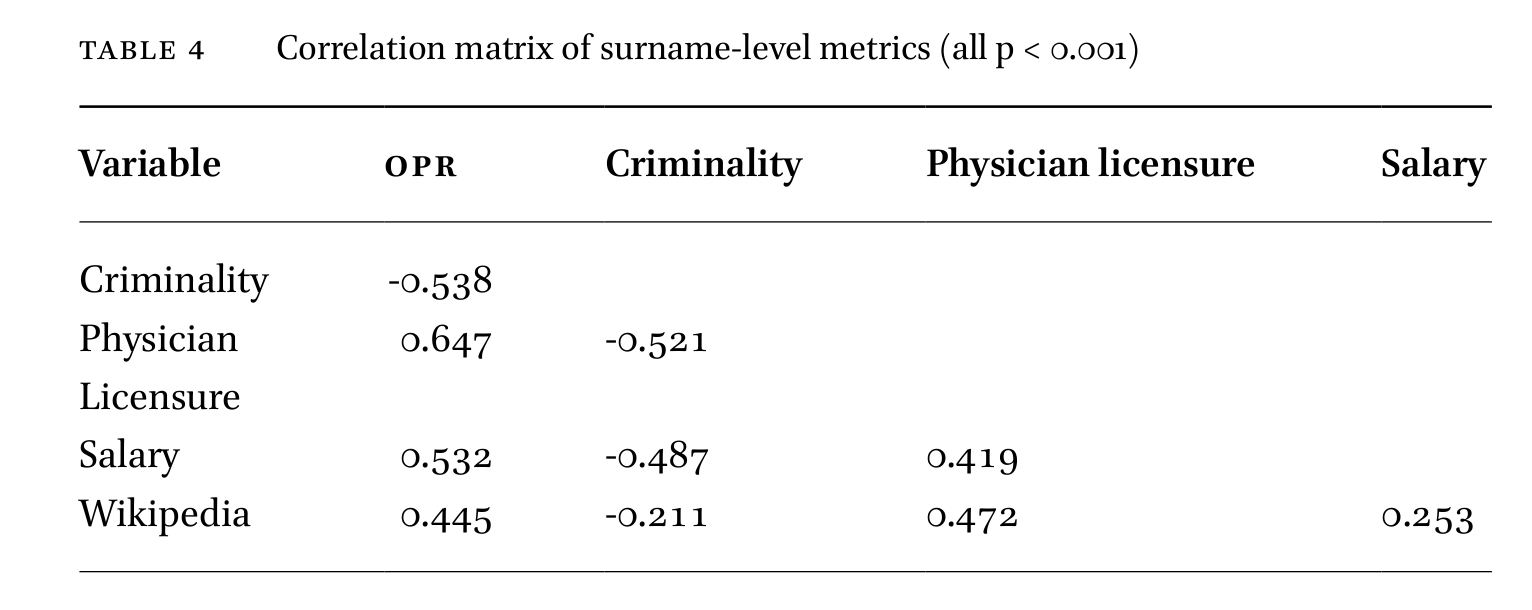
Using the ancestry proportions as predictors, one can thus estimate the hypothetical ‘pure blood’ effects on these metrics:
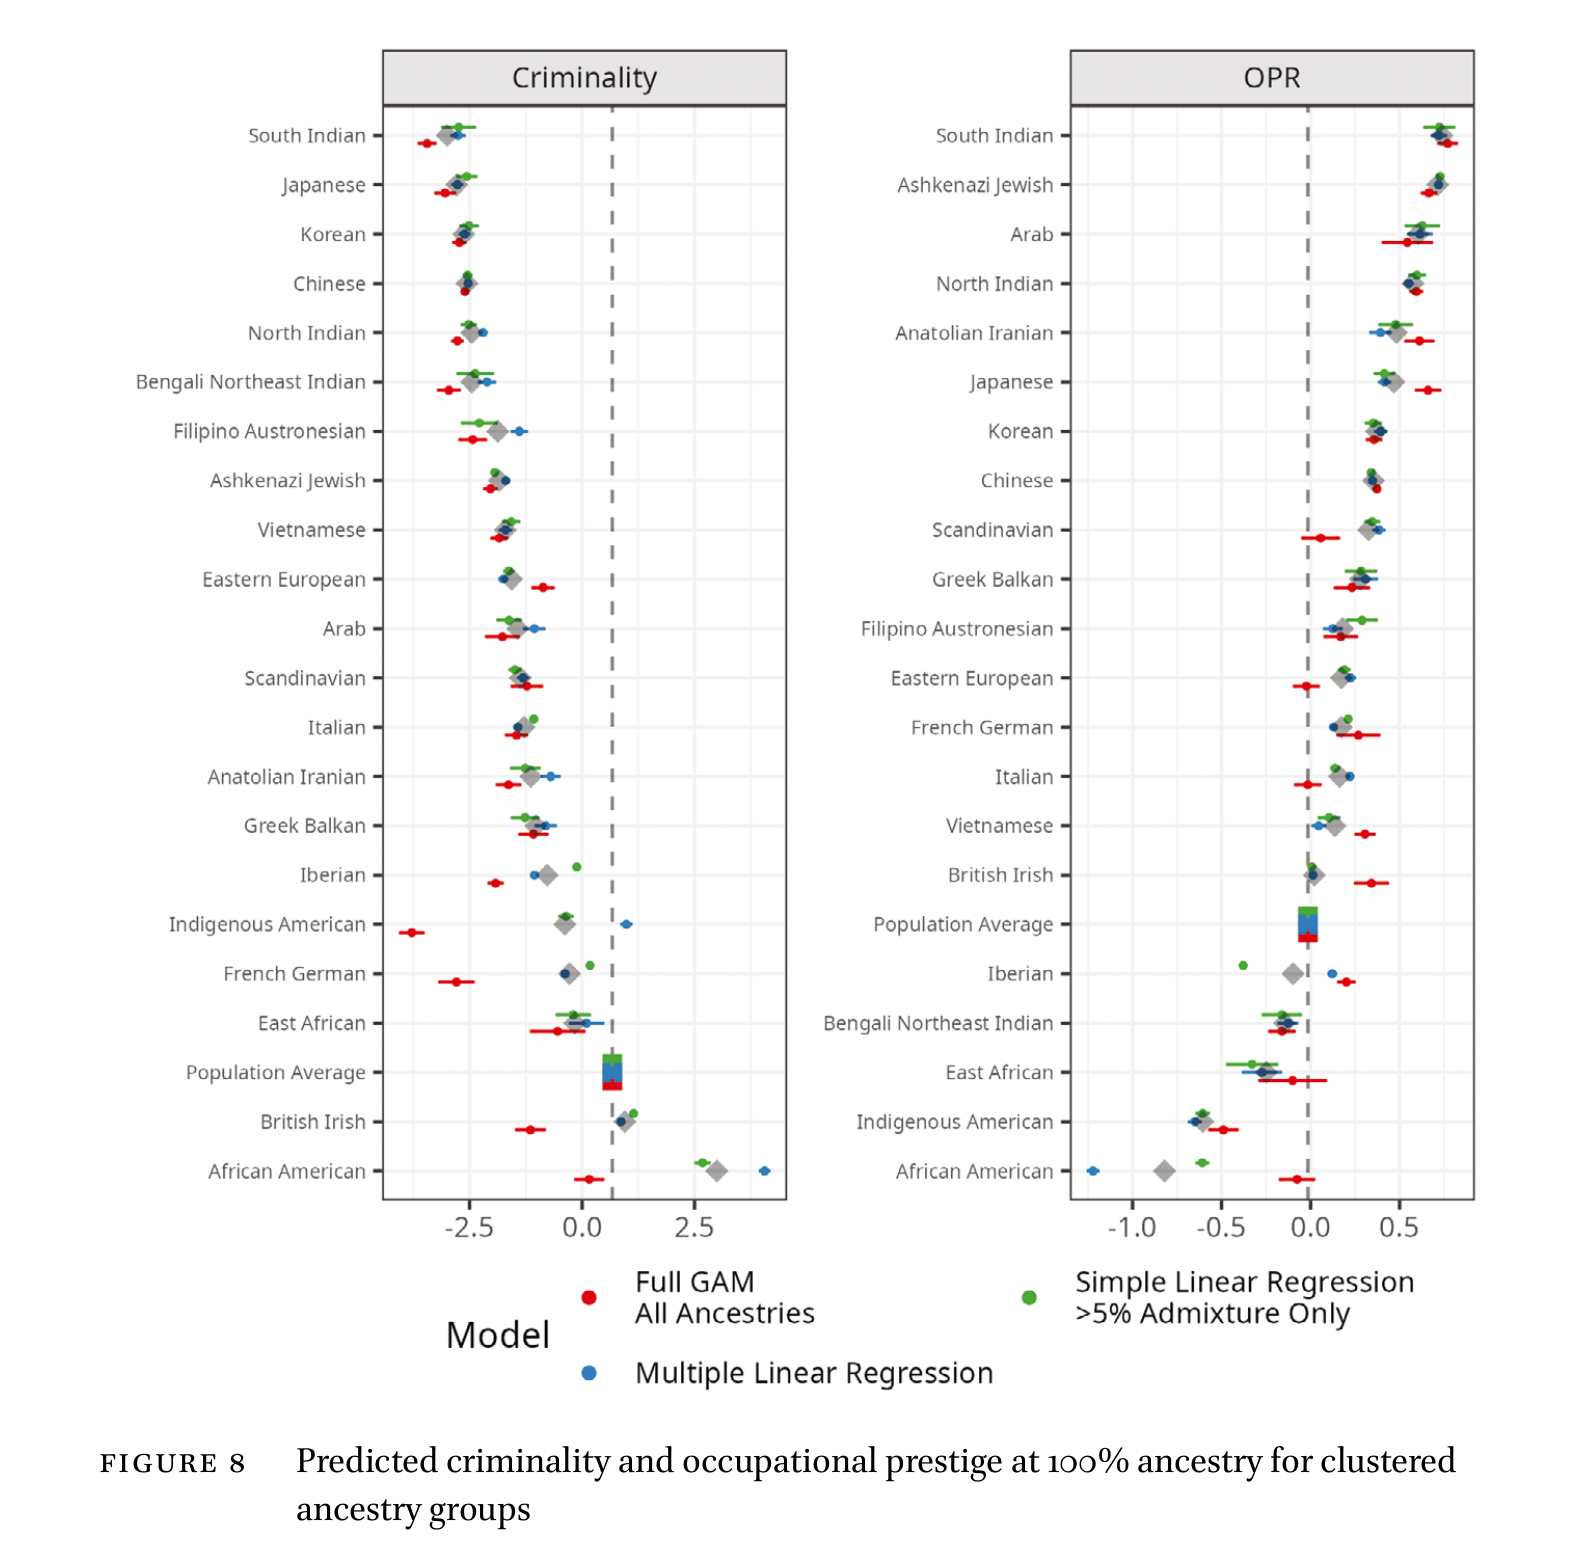
The rankings should not be too surprising for those familiar with American social or income statistics. Indians and East Asians are the least criminal, Jews and Indians the highest in occupational status. African American-related African ancestry is at the bottom of each metric, and various kinds of Europeans and other Asians in the middle. Results for the combined metric (S):
Interesting is that American Arabs do quite well, unlike in their home countries. This is the same kind of positive selection seen as for the Indians. We can see this in the American data in that a majority of Arab Americans are Christians, but most Arabs at home are Muslims. Christian Arabs are an elite group, thus revealing the selection.
The various points show results from different models. Most sensible for this kind of data is multiple linear regression, which basically just extrapolates the data for each ancestry to 100% even if this is not observed in the data (blue dots). Simpler is the singular linear regression, one at a time regression as we know it from GWASs. This ignores how ancestries are combined in individuals, e.g., maybe Sudanese ancestry is mostly found in people who also have British ancestry for various colonial history reasons, which would pull both of them in the same direction. There was also widespread evidence of nonlinearity. This kind of thing is not generally expected on genetic grounds but can reflect peculiar assortative mating or self-selection issues. This is most markedly seen for African American related African ancestry (Nigerian, Ghanaian, Angolan etc.), which shows quite divergent results for the linear vs. nonlinear models. What it really means is that the names with very high African ancestry are not performing as poorly as one would expect from the extrapolation from names with small amounts of such variation, e.g. from 0 to 10%. In this case, it probably is because of recent “Black African” elites coming over, whose distinctive surnames allow for easy tracking and who do not perform as poorly as the resident African Americans. We tried to avoid the worst problems with this extrapolation (e.g. the most Sudanese surname was only 18% Sudanese) by combining small ancestries into sensible genetic clusters. The decisions made here can be questioned, and more details are given in the study.
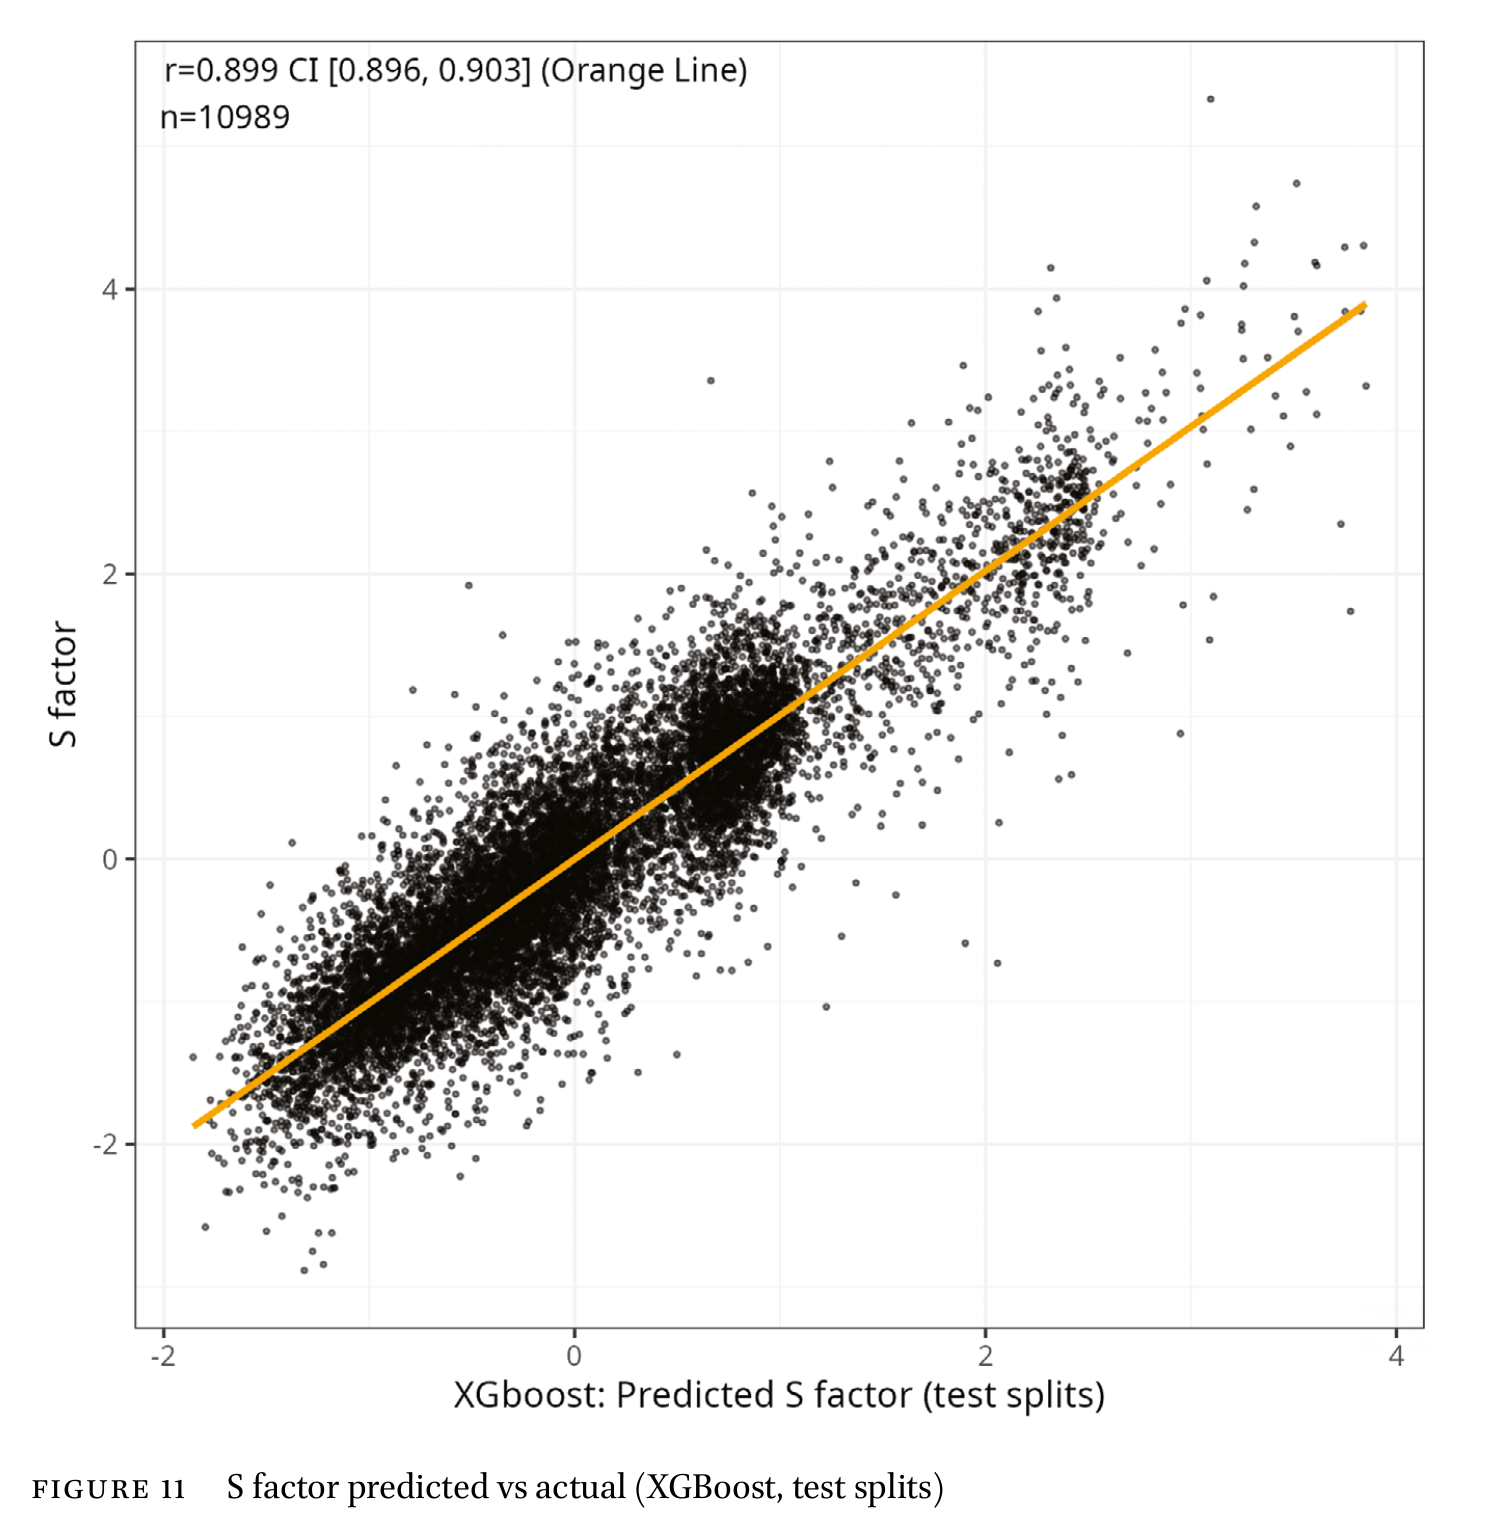
Overall, we can say that surnames’ relative social standing is very predictable:
Thus, there is quite a lot of information in a surname. These predictions work well for names, but of course at the individual level (if you meet someone called Brown), the predictions are not going to be fantastic. Still, the odds are good that someone called Rubinstein (Jewish) is going to outperform someone called Mohamed (Somali).