Given the ease of obtaining scraped datasets with Claude Code, I thought we could update my 2019 study of mental sports with the newest data and better methods. The primary source of data is https://www.esportsearnings.com/ which tracks winnings for esports across games. These are then aggregated by player, country, game etc. in various ways. It’s possible to get the listings of all competitive players for a given game, so these can be used to calculate competitive players per capita rates for individual games. These numbers are subject to the usual small-n instability, but show reasonable correlations:
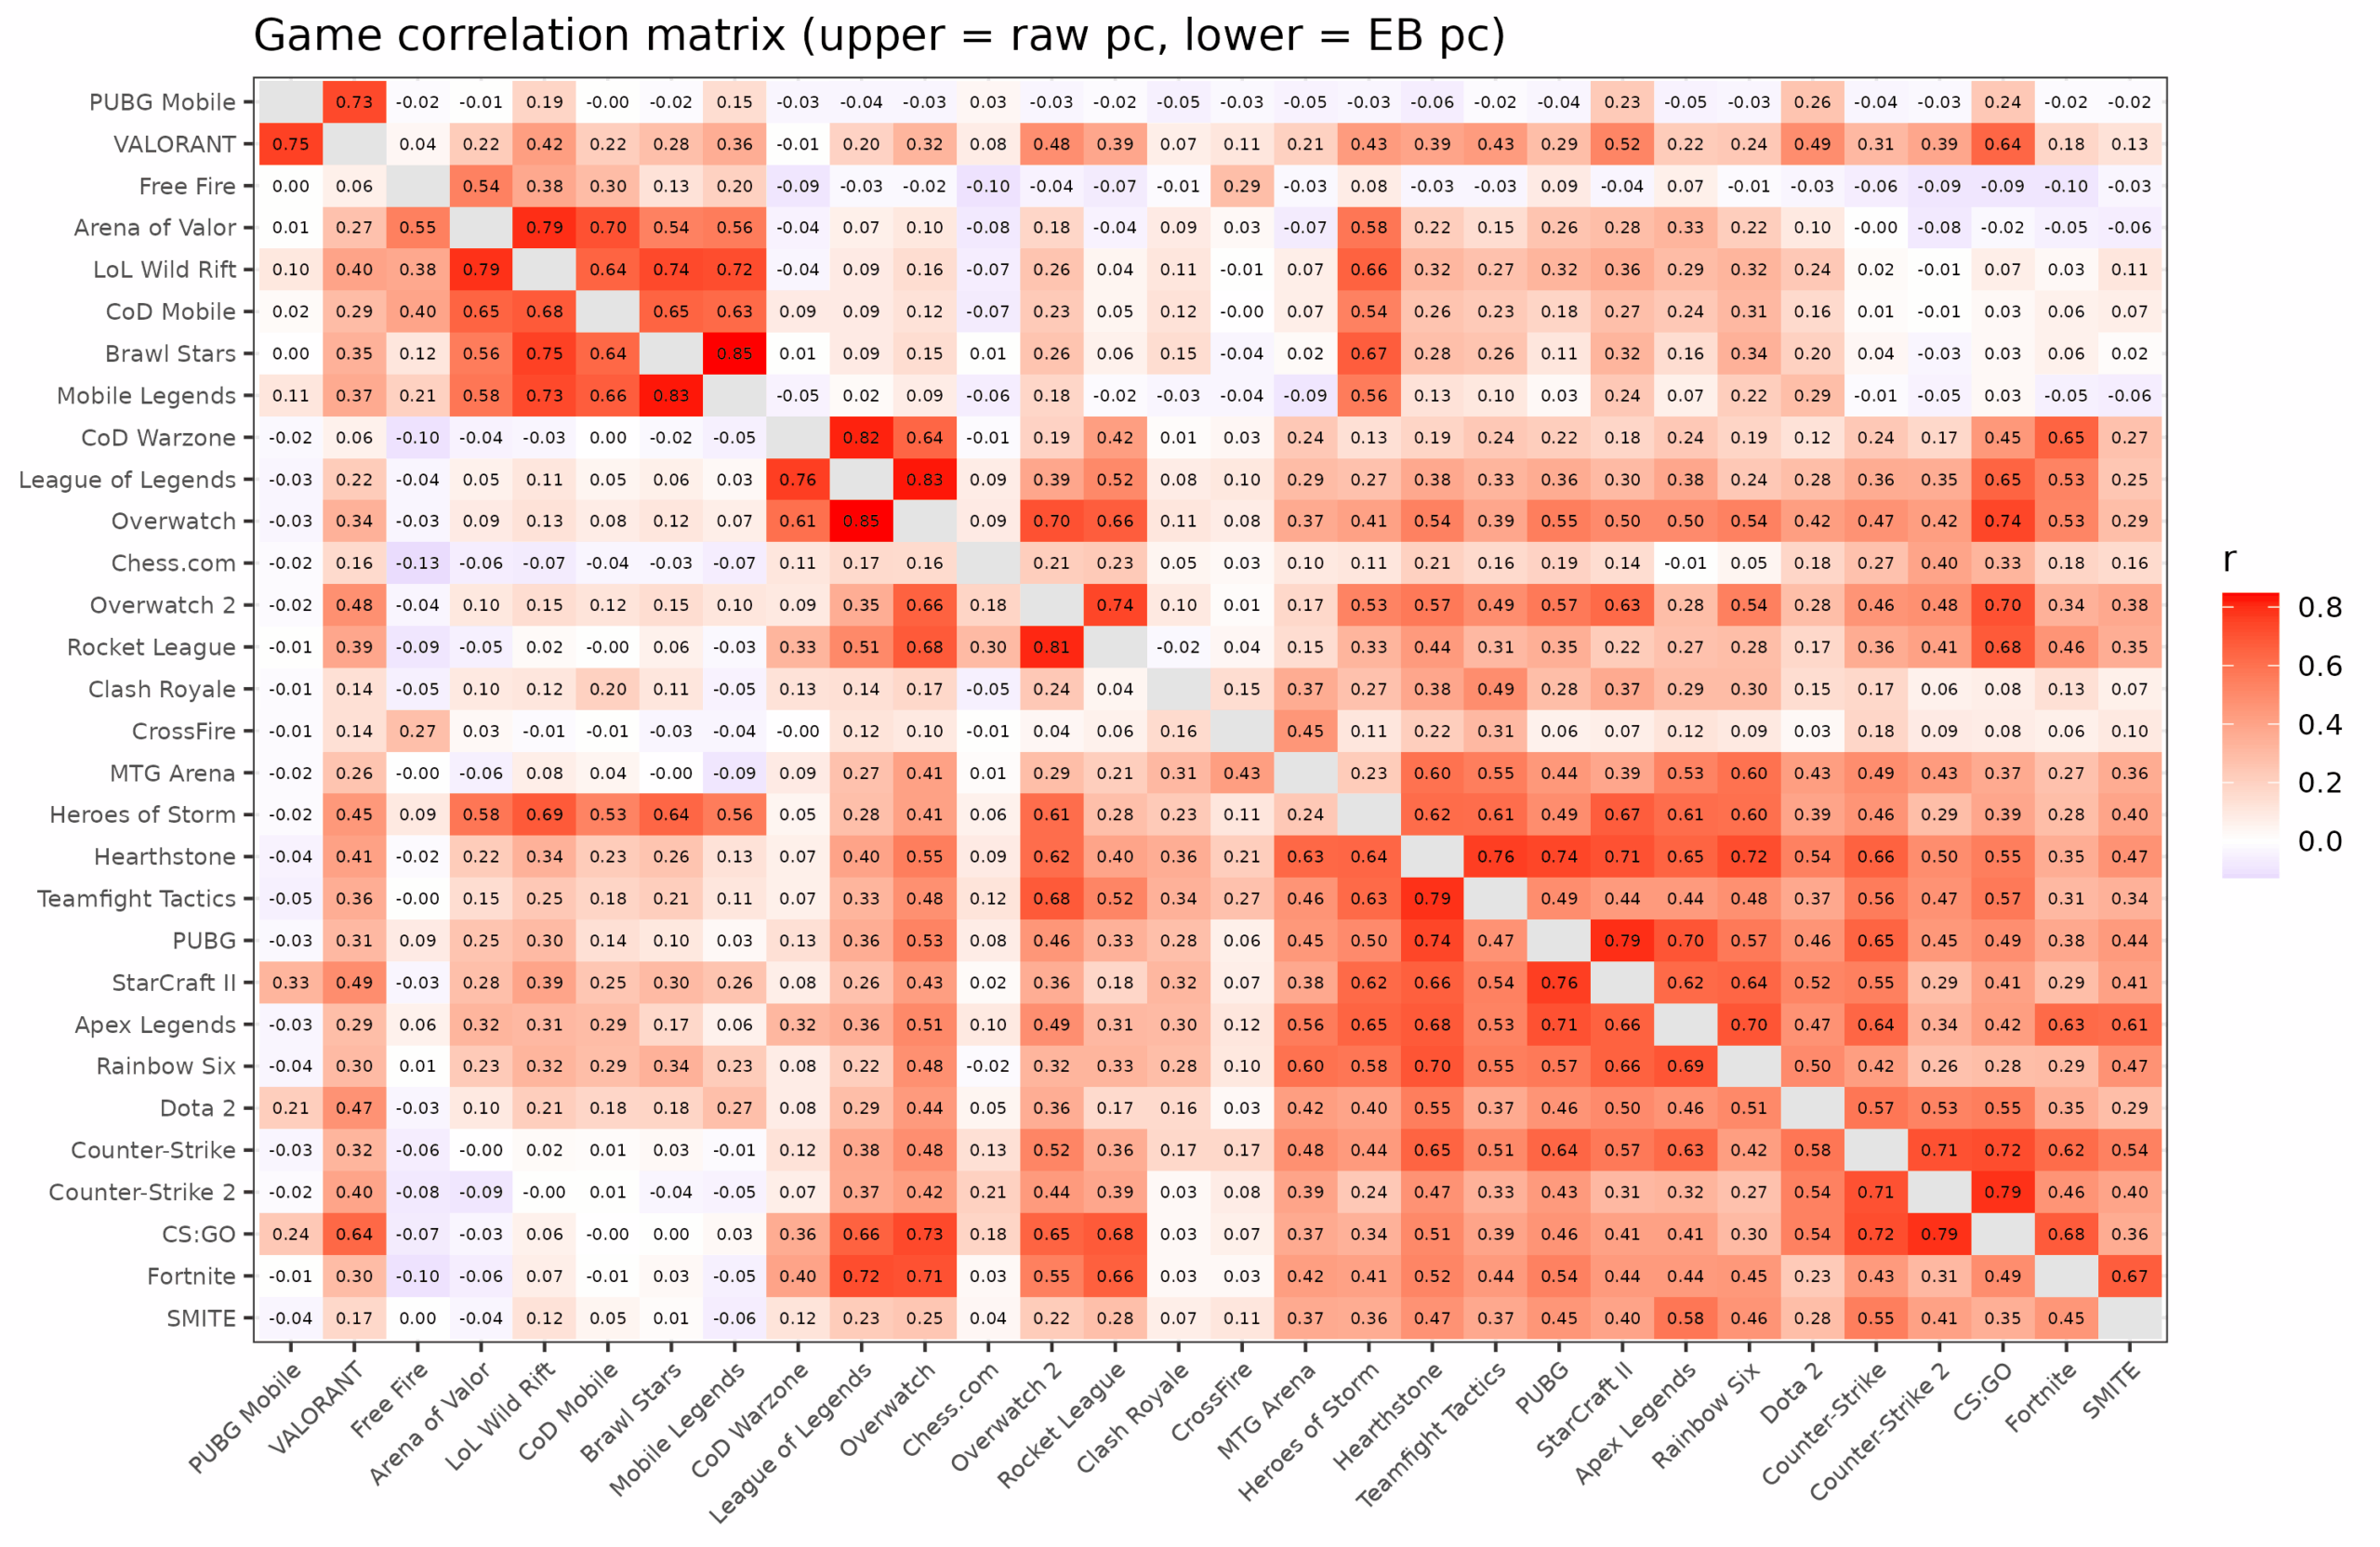
Generally, the correlations are positive as expected — countries that have more top players per capita in one game also have more in other games — but not entirely so. There are some clear clusters in the data related to game type and platform (PC vs. mobile). The top left cluster are mobile games. Chess.com is also there as the only non-esport of sorts, even though it is played on a computer. It’s mostly uncorrelated with the others. These are the top 30 games, which is an arbitrary number I chose, and one could pick a larger number. Since I wanted to do factor analysis on these variables with ~150 countries, I cannot have too many games as it makes the results potentially unstable.
The question now is how to score an overall esports skill or at least competitive performance score. Traditionally, one would use a single factor model via factor analysis. This will down-weight the games that don’t correlate with the other games (so especially chess and CrossFire). On the other hand, these in part reflect cultural differences, which are arbitrary to some extent. An unweighted z-scored mean is more defensible for a culture-neutral score, which is what I opted for. Country performance by region:
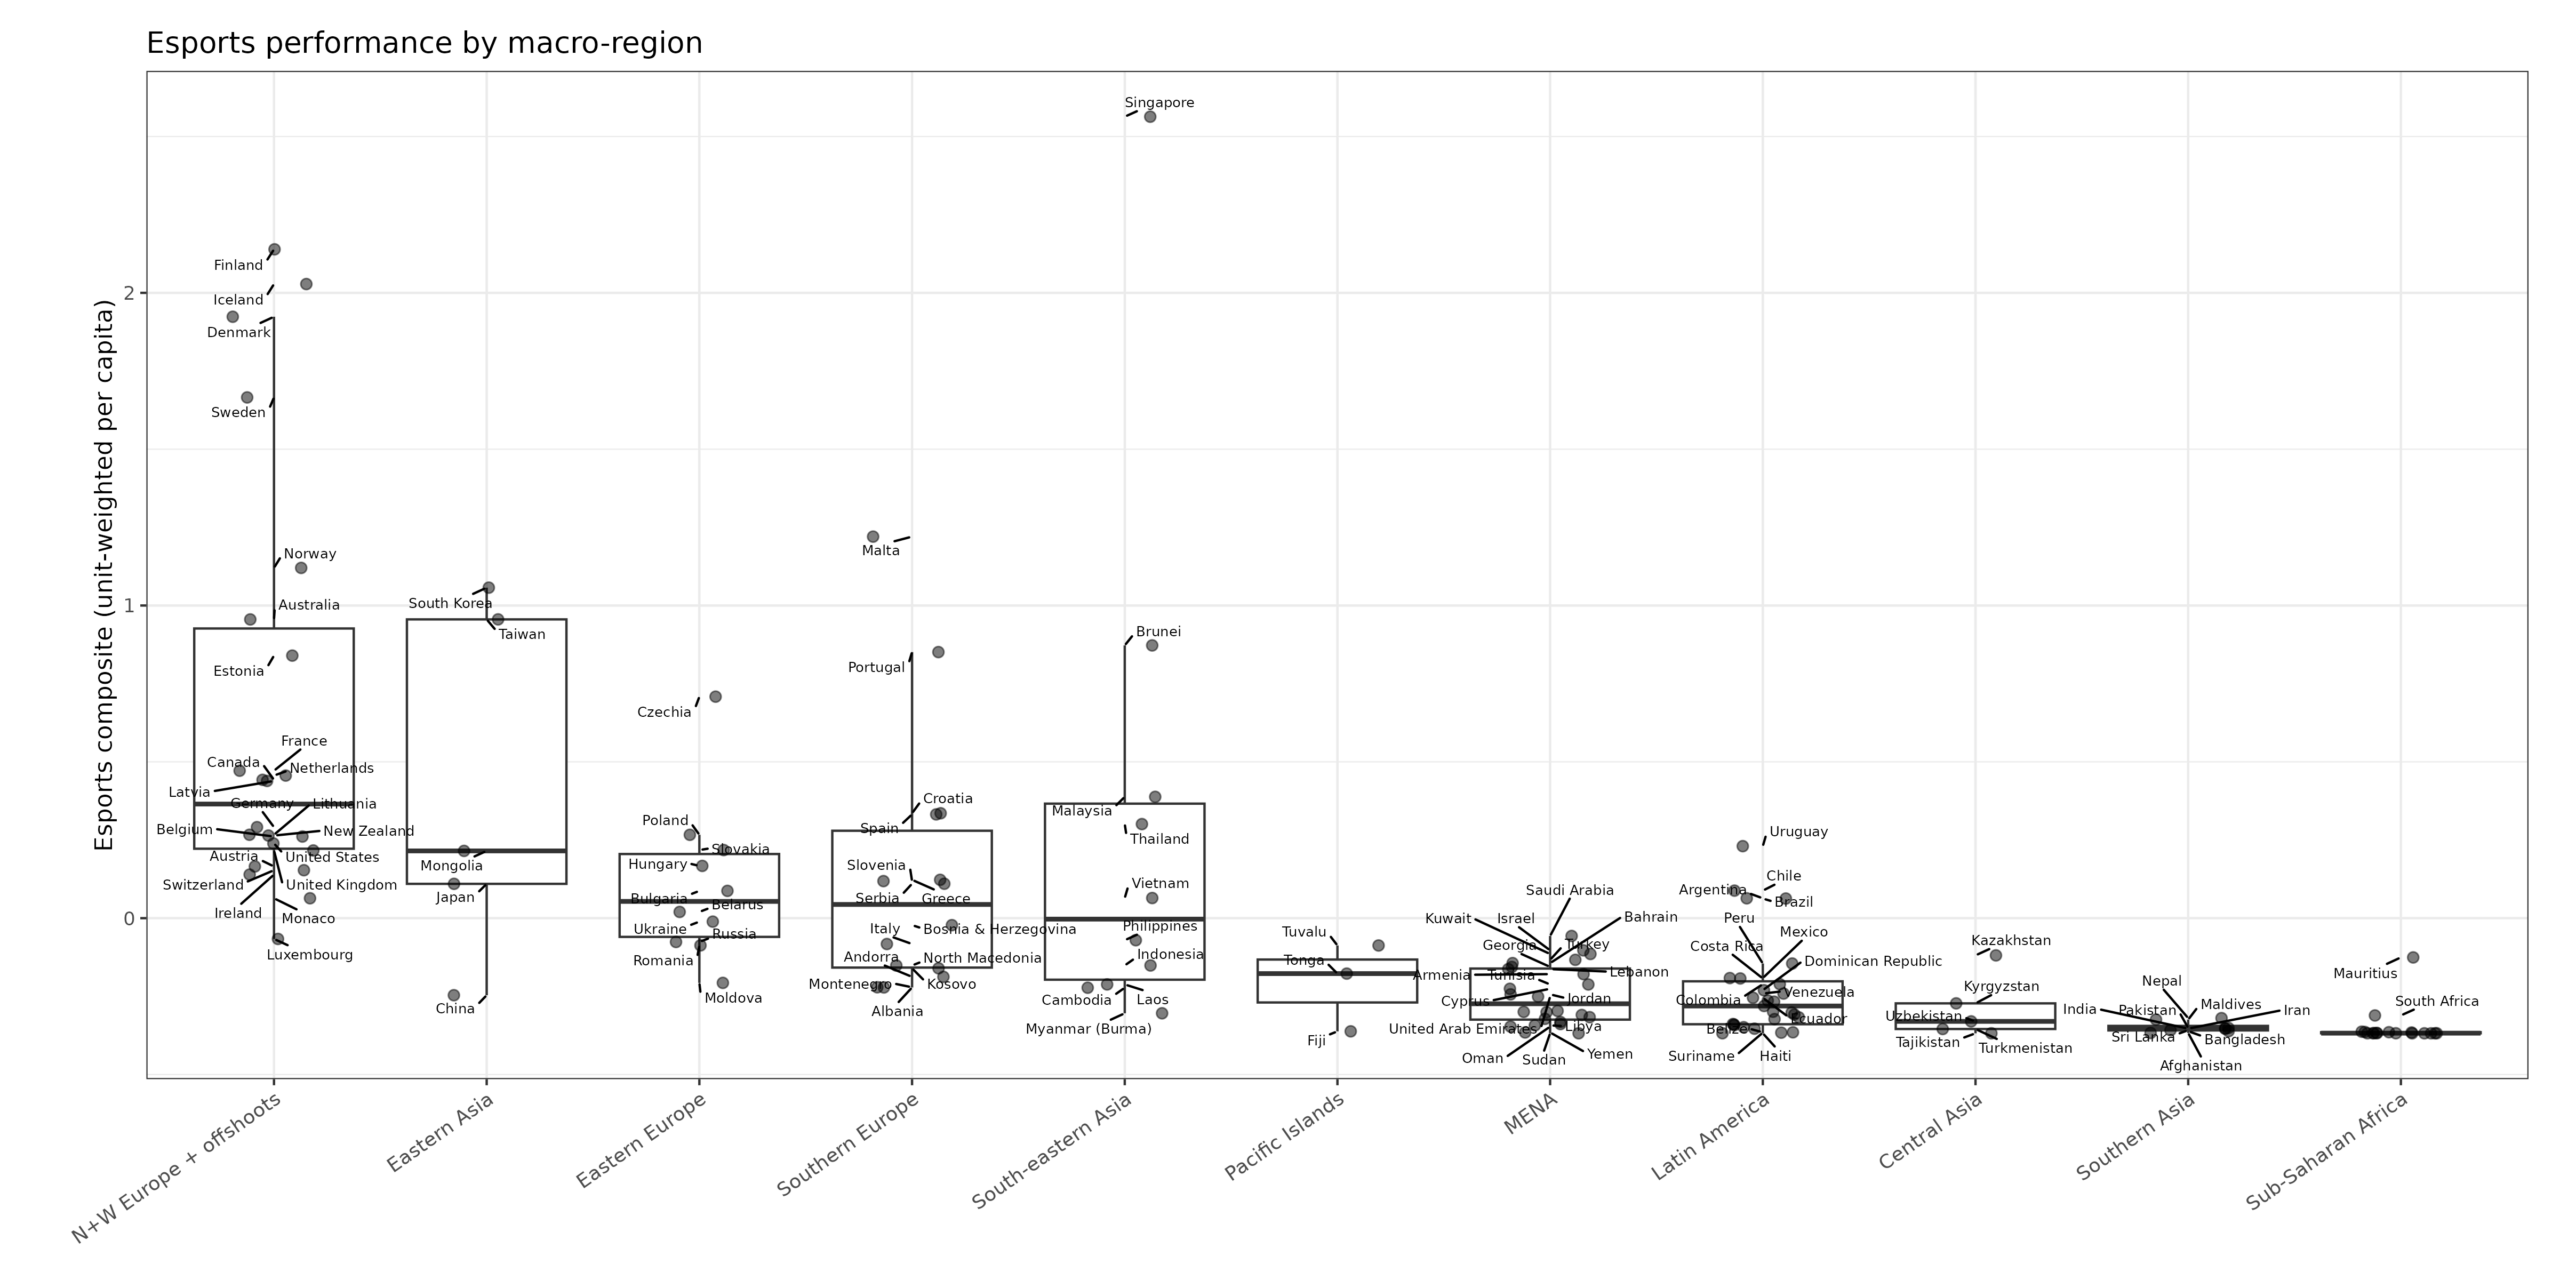
We see that Singapore is performing extremely well. This is because it has extreme scores (like +10 z) in some mobile games popular in southeast Asia that few others play. If we instead let factor analysis assign weights to games Singapore ends up rank 5 instead, so it isn’t super important which method is used.
It looks like this with national IQ:
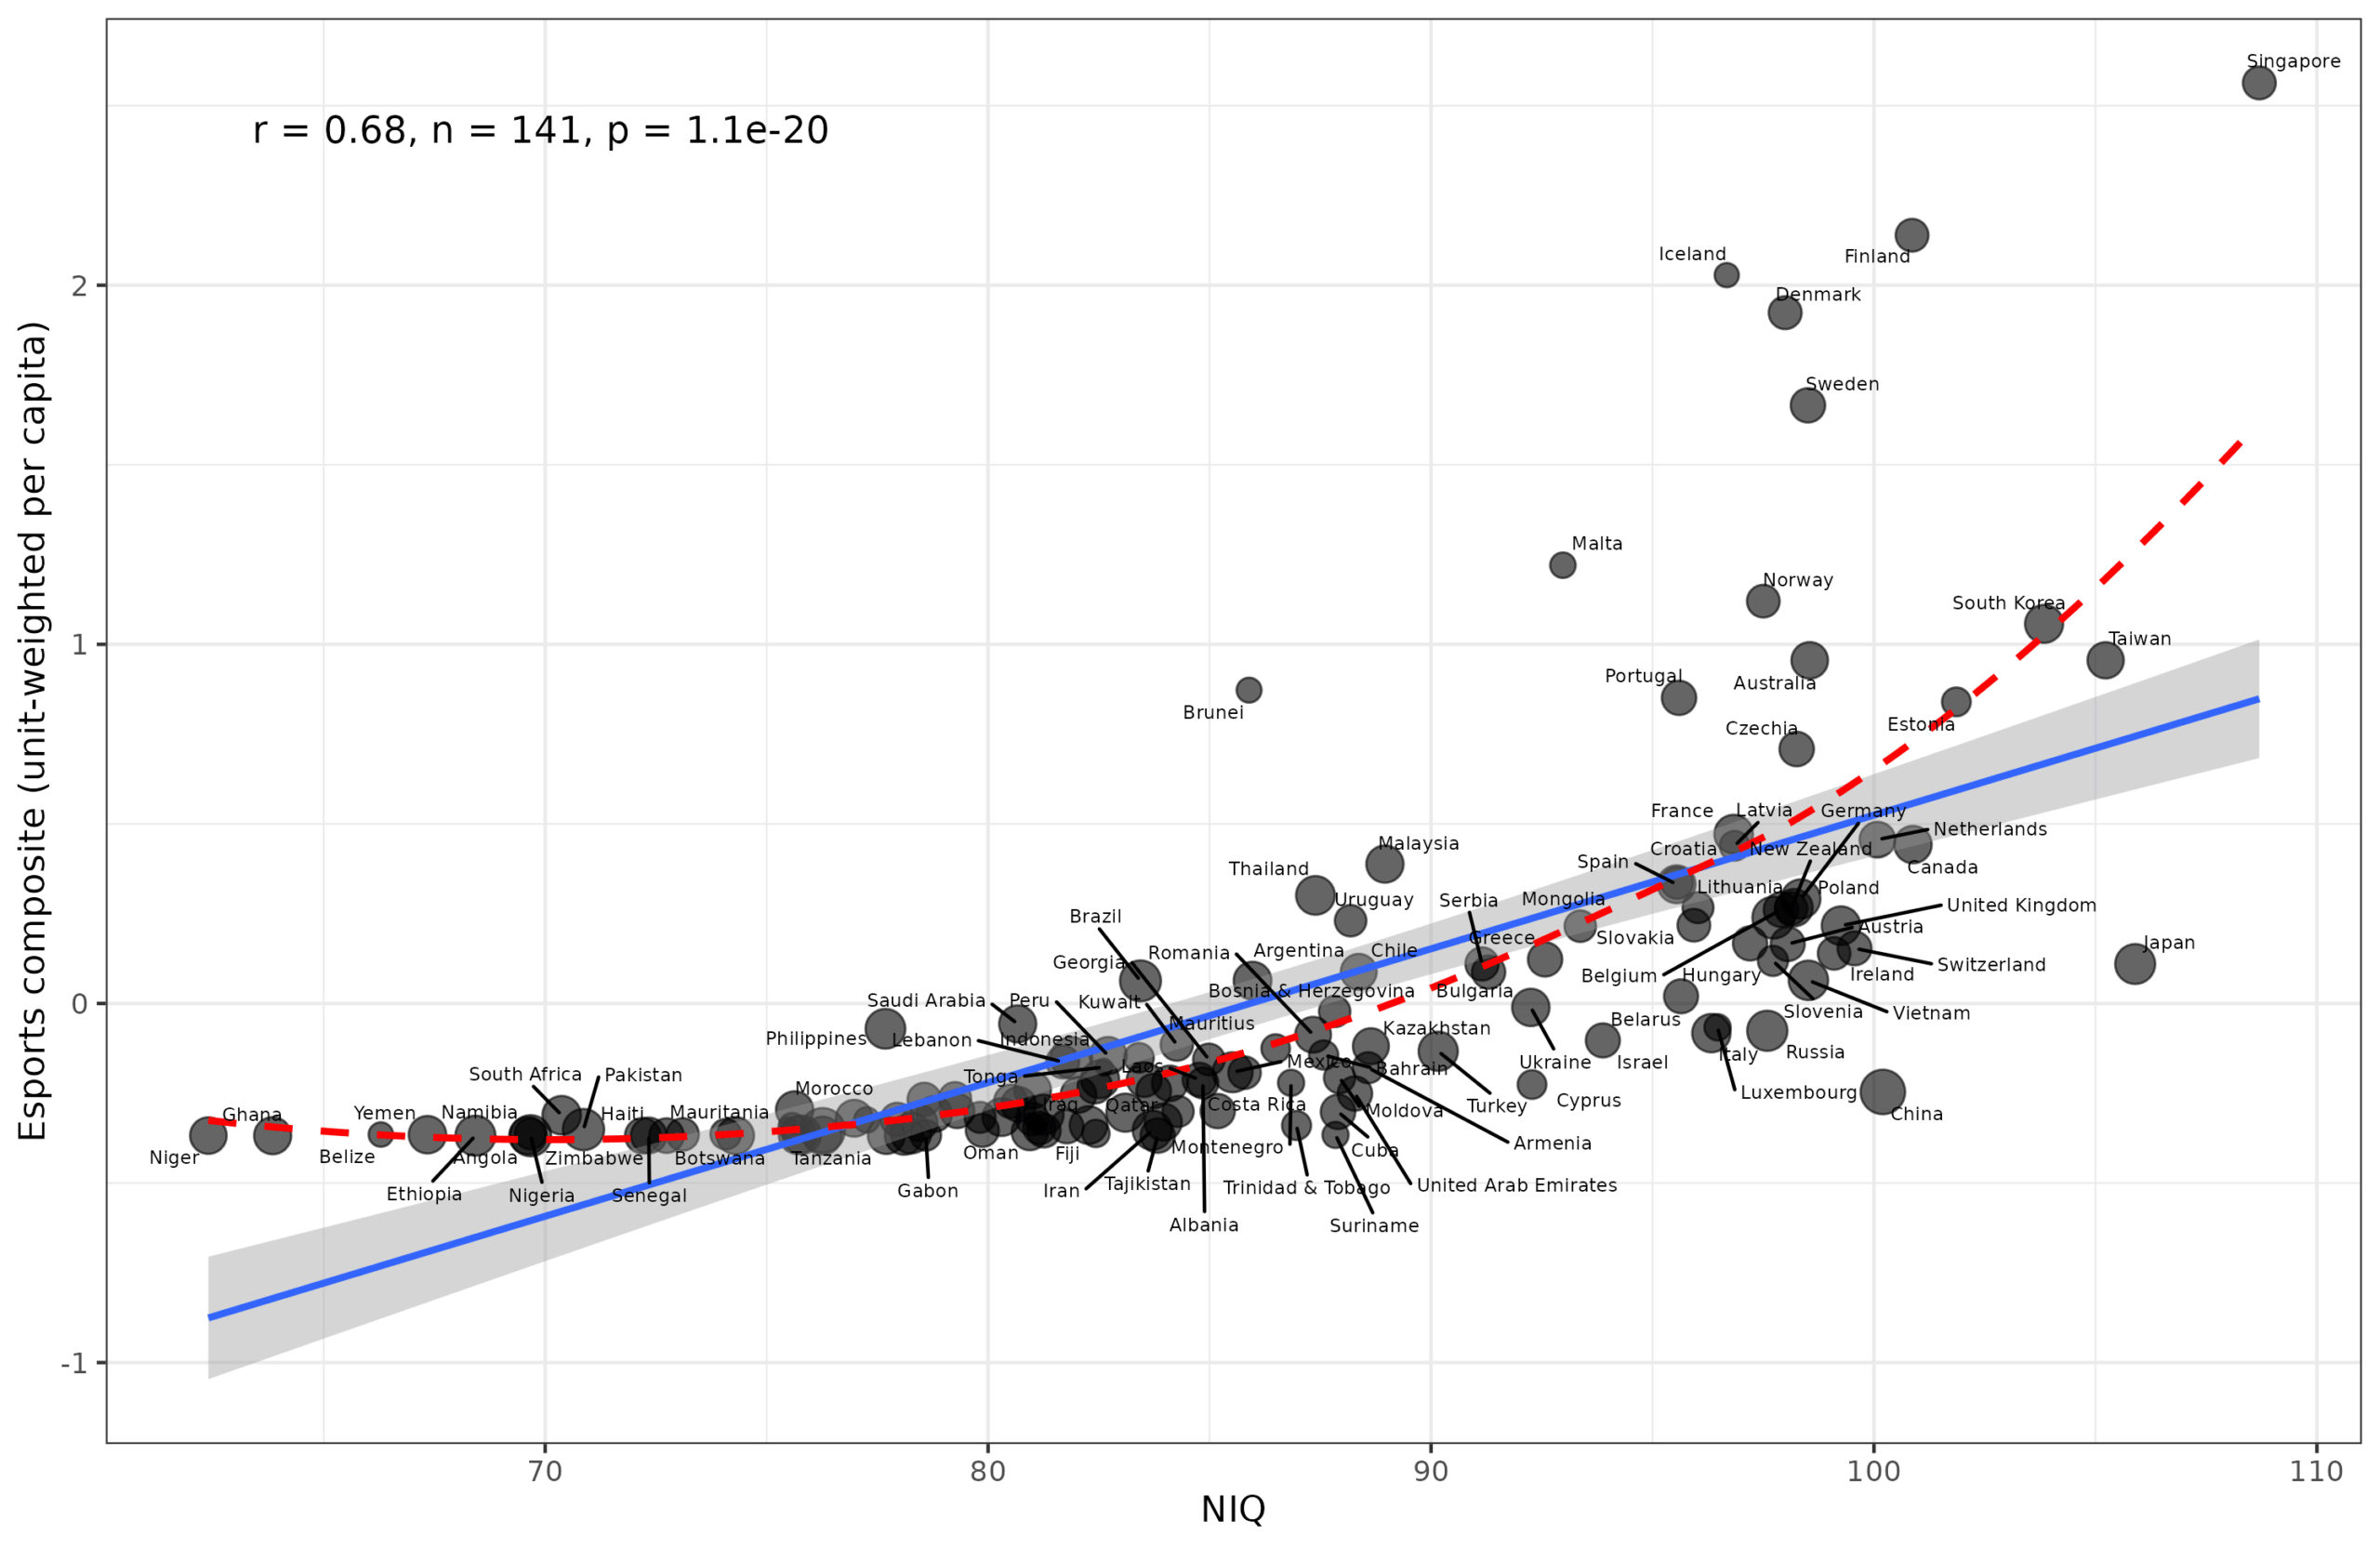
There are about 50 countries with no players. These either don’t have enough skill, freedom, or inclination to participate. One could add them to the left side of the plot given their no-show status, but it’s a bit lame. If you include them anyway, the correlation is about the same (0.67). The relationship is nonlinear, sloping upwards. This is in line with the smart fraction model. Presumably, top esports gamers are predominantly from the right tail of intelligence, so given the nonlinearities of how the population mean relates to % of population above some IQ threshold, this predicts a nonlinear sloping upwards pattern like we see.
We can investigate the nonlinearity and control for any ‘confounders’ or downstream causes. Some models:
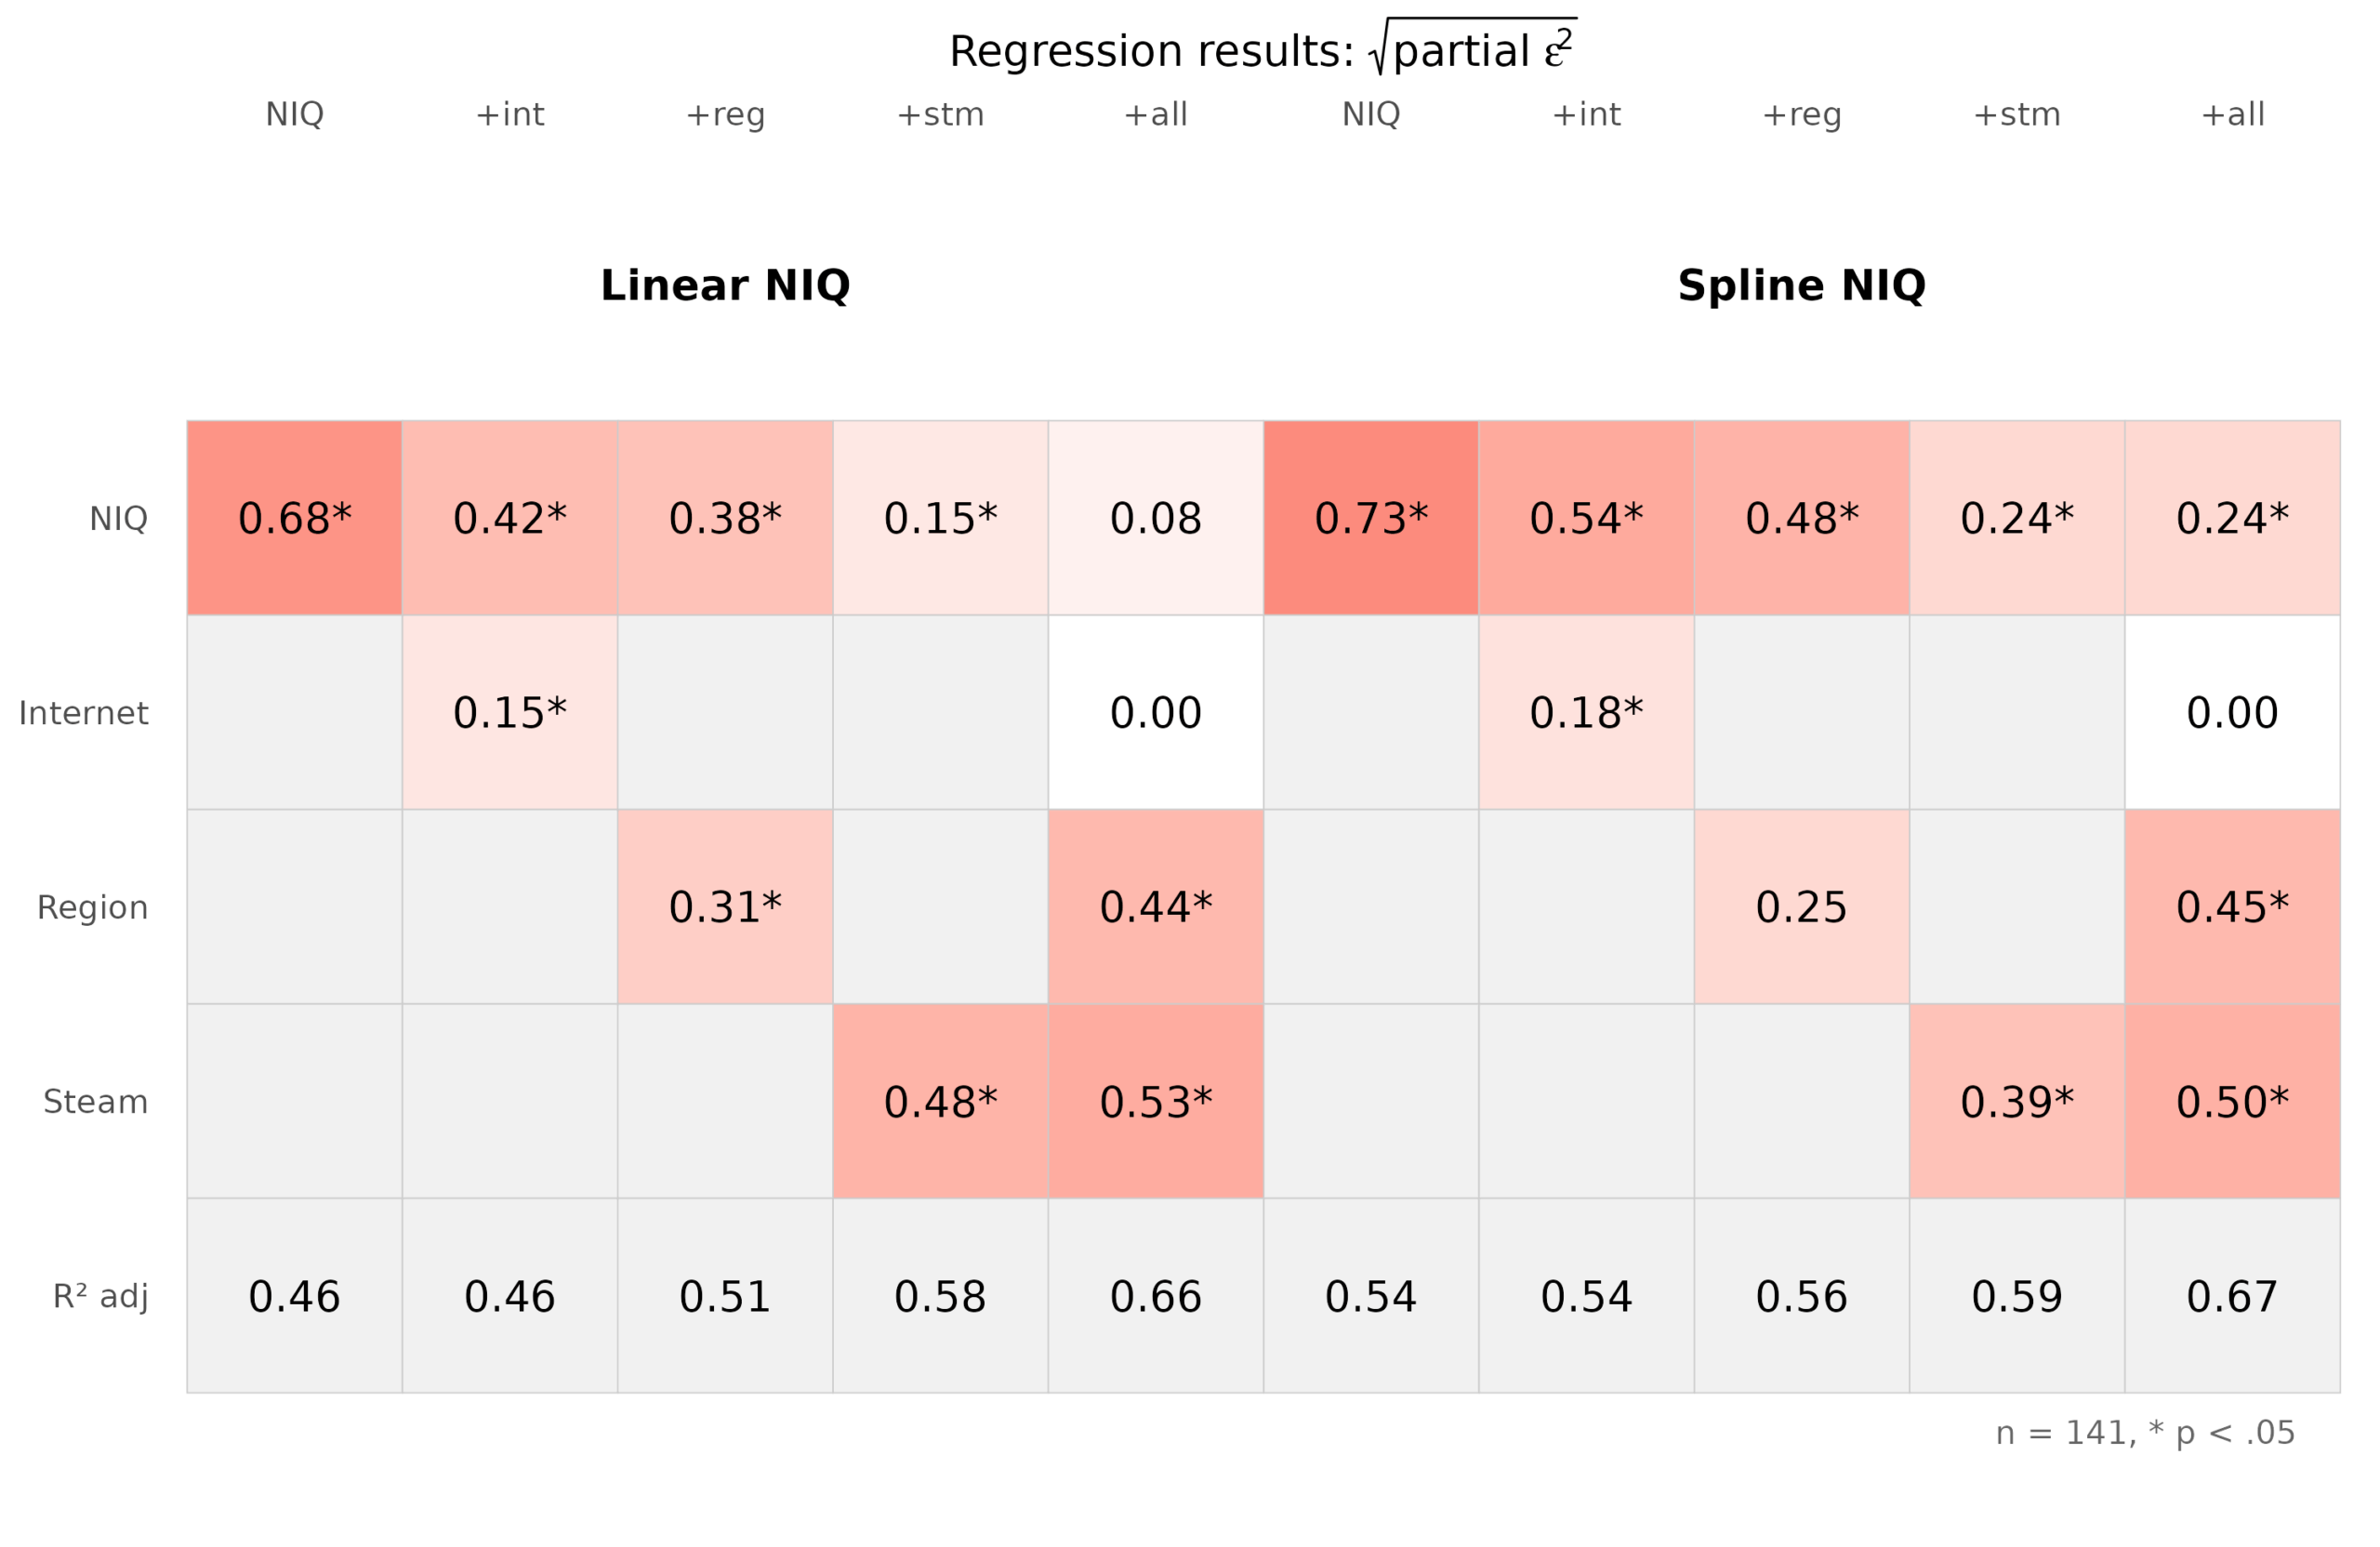
These are standardized beta equivalent values. To deal with factors (nominal) variables and complex variables (splines), I have computed the partial epsilon squared values. These give the unique variance explained by each set of variables adjusted for overfitting. Taking the square root of these puts all variables on the same correlation-like metric for comparison purposes. The models show what happens to NIQ’s validity once you control for some other variables. Internet is % of population with internet. It is difficult to win esports if you can’t play online, but internet access is also downstream of intelligence of the country, so it’s controlling for a mediator. Steam is the Steam traffic per capita, or how much people use Steam. Steam isn’t the only computer game platform (Battle.net etc.) but it is a useful overall index of esport participation. Controlling for that mostly removes the linear effect of intelligence, though not entirely the nonlinear effect, seen in the last model. Even comparing countries within cultural regions, controlling for internet access, and how much they use Steam, intelligence of a country still predicts having more top players.
There are some other possible metrics and methods one could use, but it doesn’t matter too much:
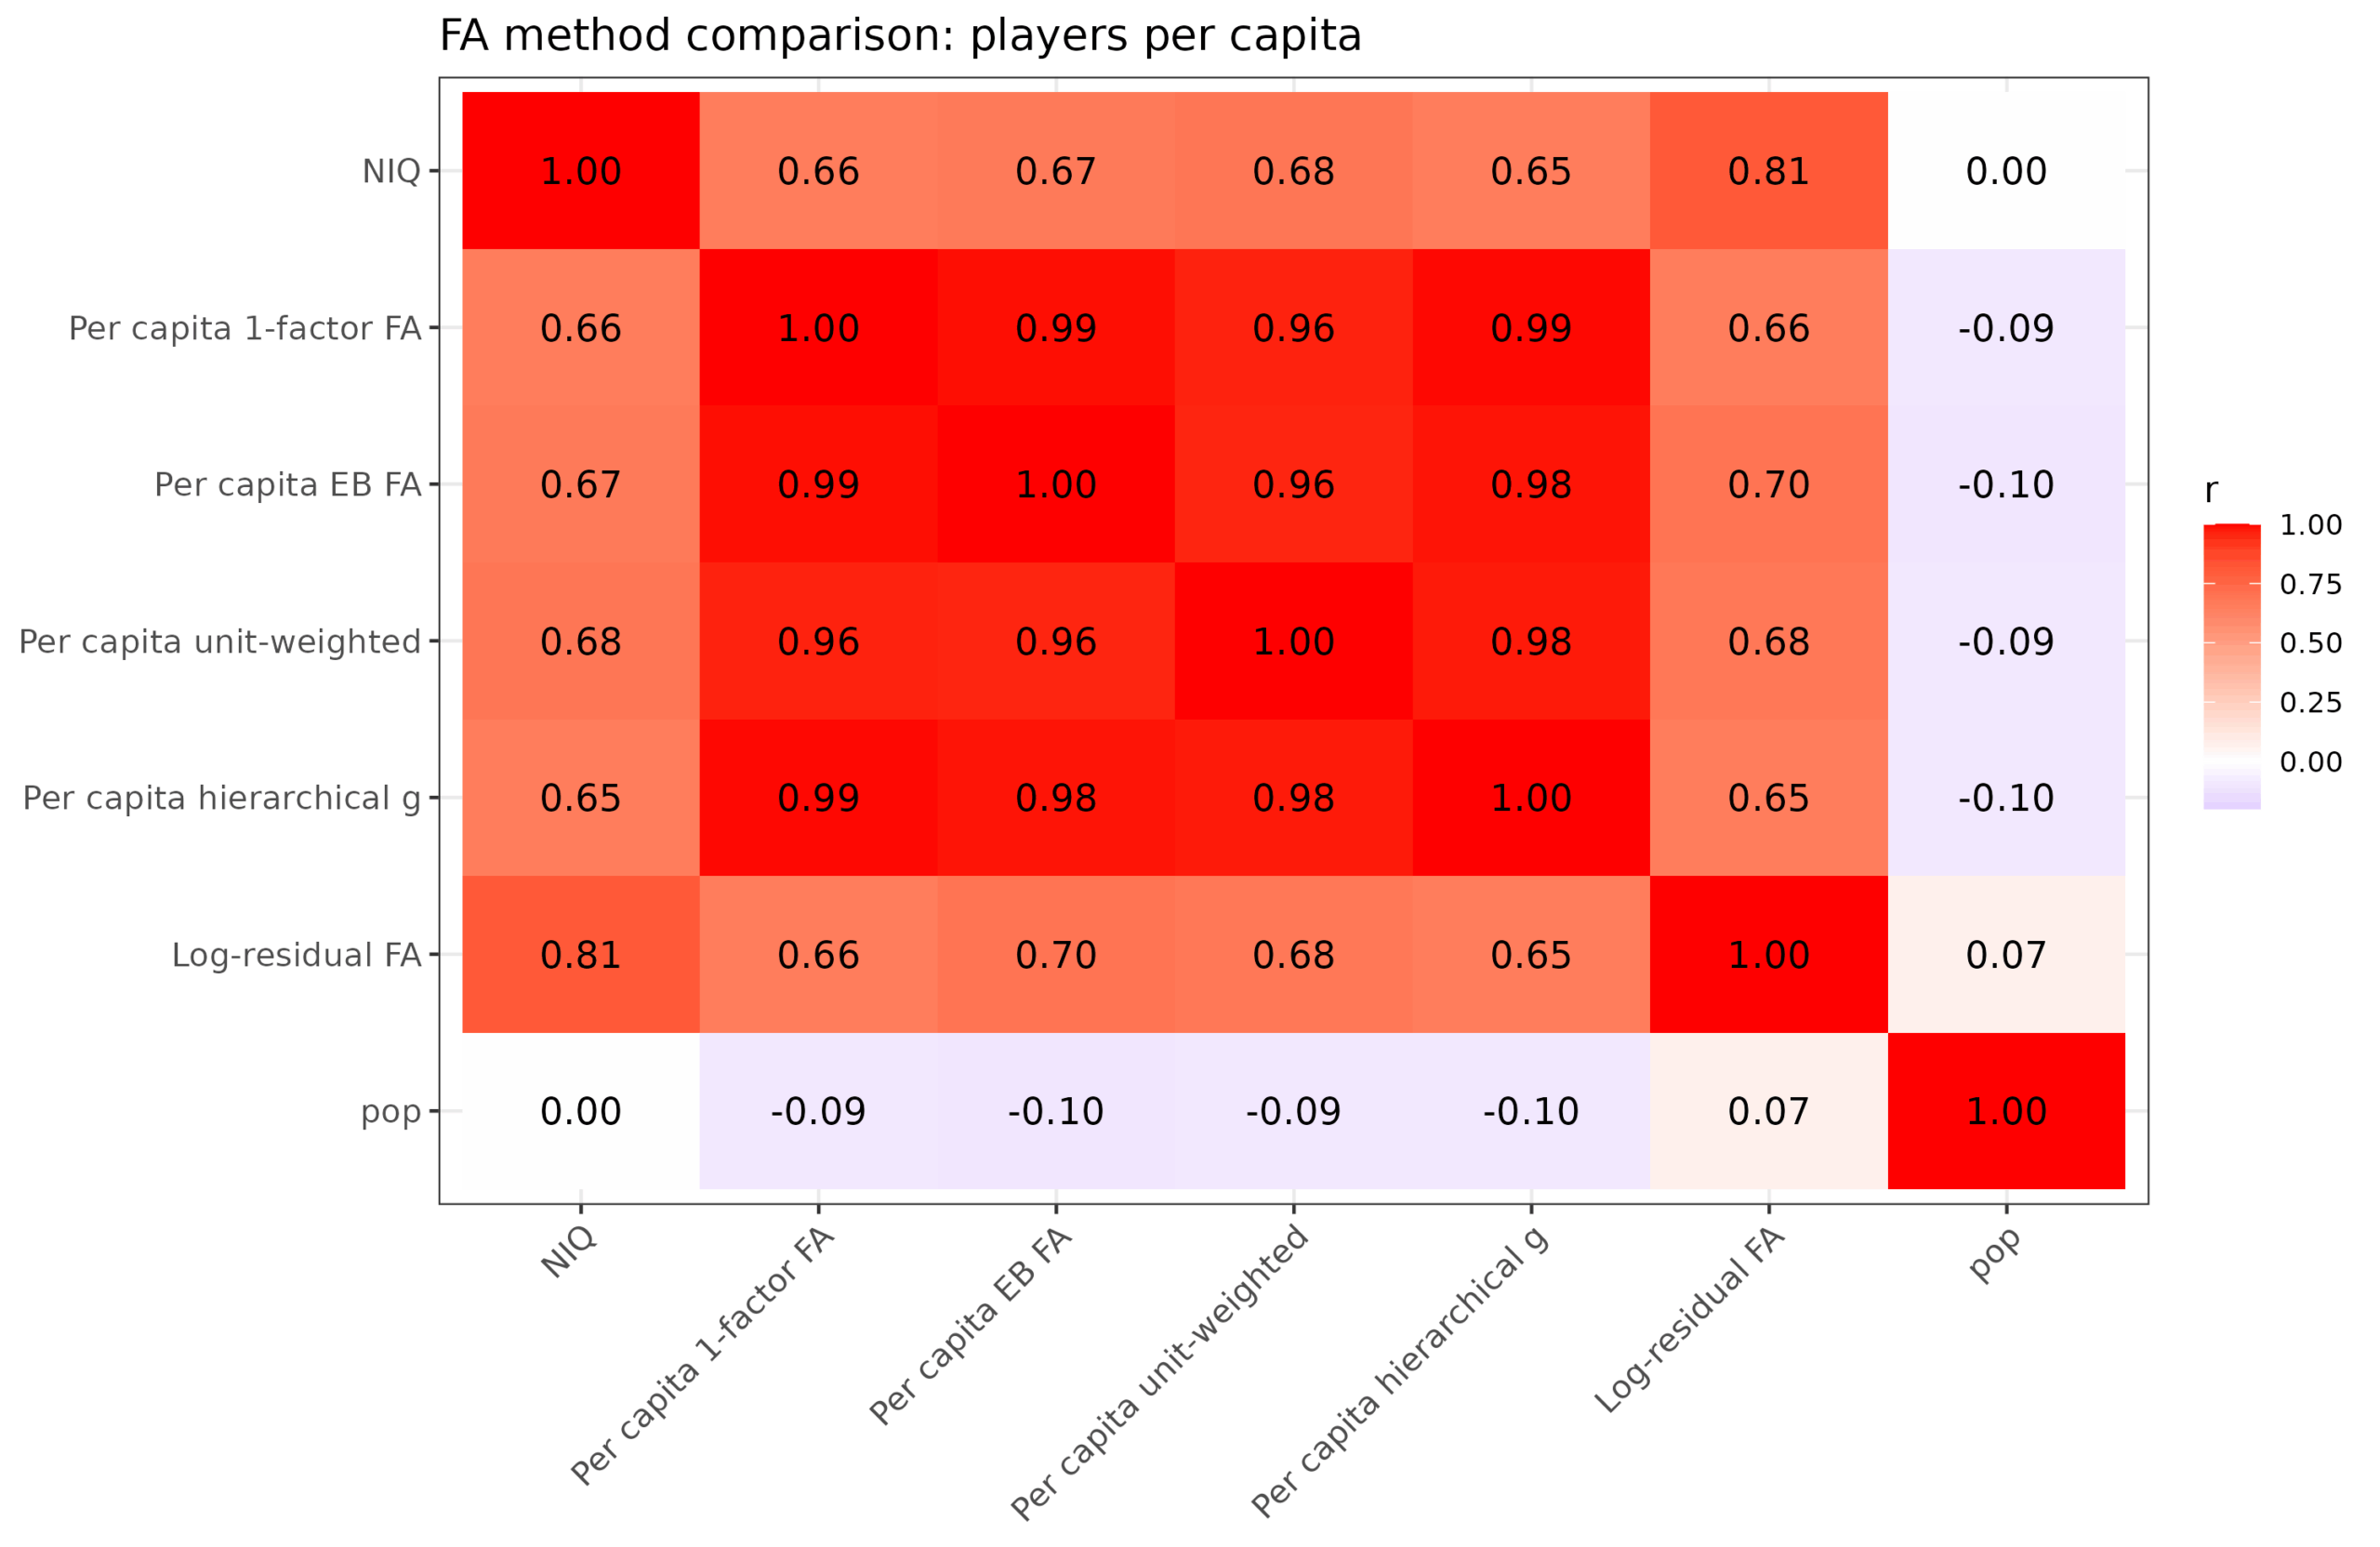
The log-residual approach is what I used in the prior study. It’s a somewhat inappropriate model that favors large countries given that they are more easily able to achieve large residuals. This happens to favor China and USA, which boosts the IQ correlation given their NIQs. USA only ranks 28th on the unweighted z-scored mean method, but 1st on the inappropriate log-residual method. China ranks 85th in the proper model and 11th in the log-residual model. India stays about the same. Again, no signal of any special missed Indian intelligence (77 IQ estimated from esport performance). Iran for that matter is estimated at 77 IQ also, too low, presumably due to inability to use the internet freely.
And just for reference, for the per capita fallacy readers out there, here’s some results without per capita applied:
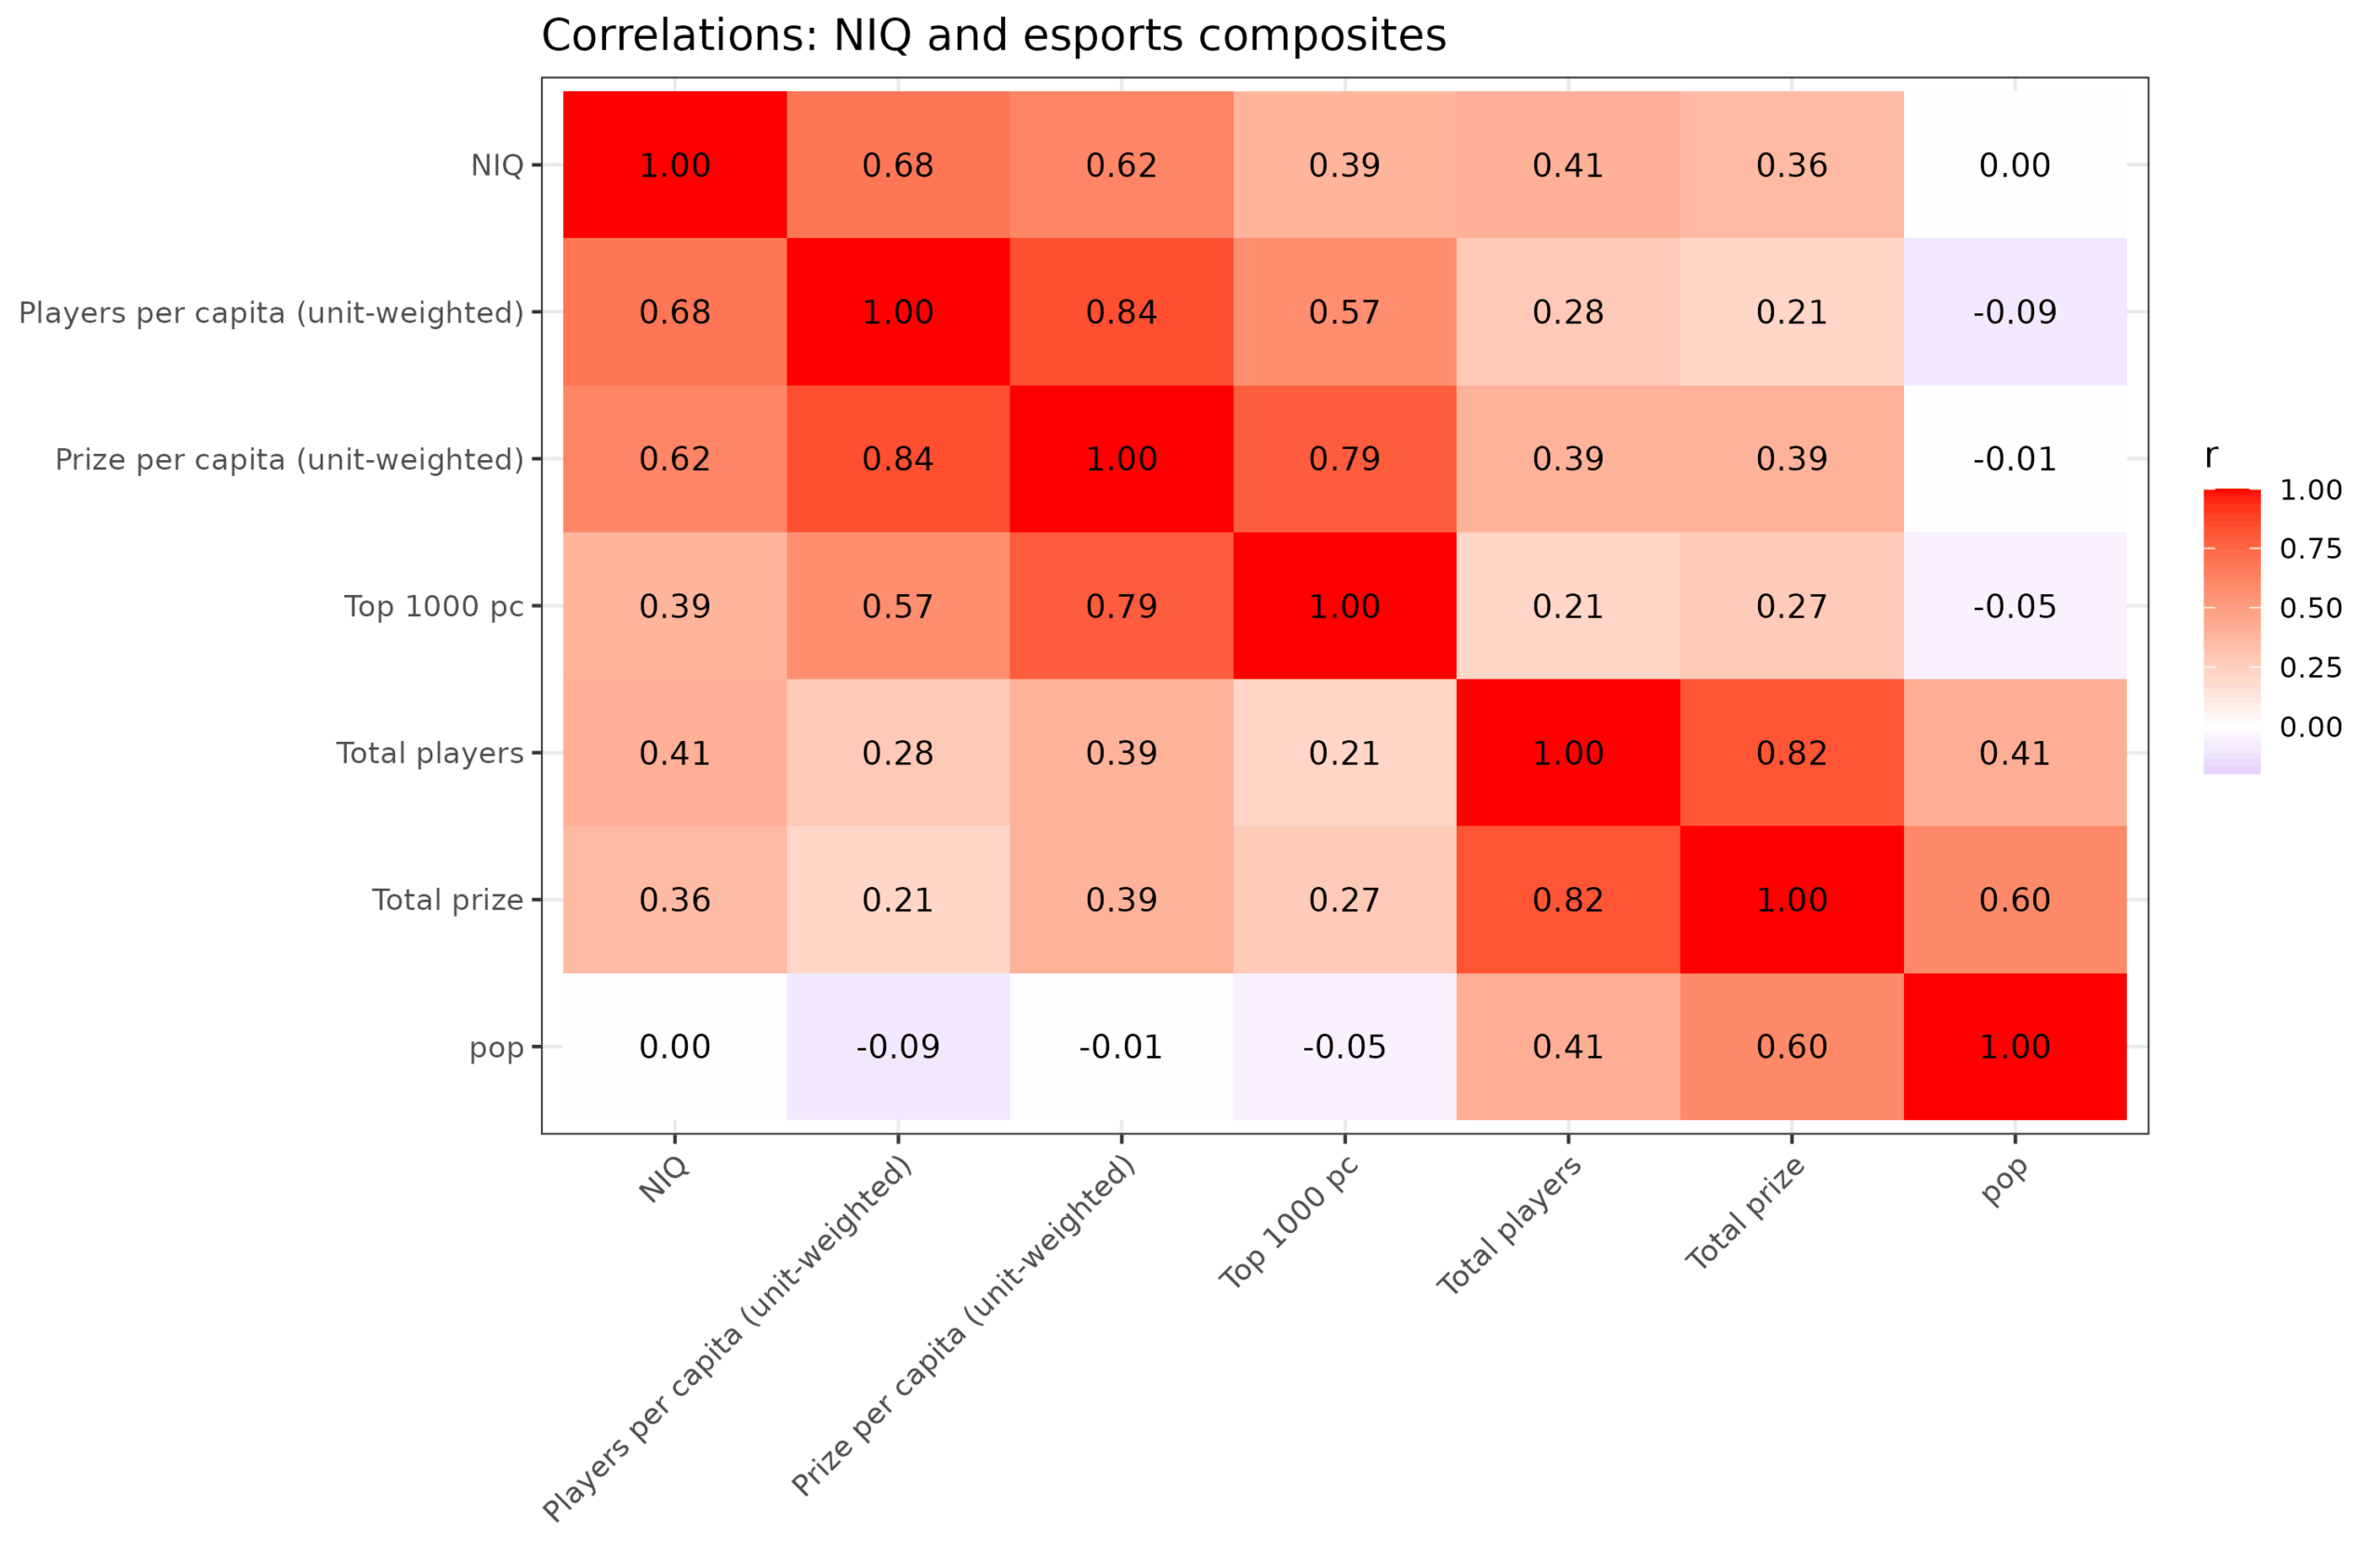
Total number of competitive players, and total prize money both have a decent correlation with population size, which is obviously a big problem since population size isn’t related to quality of a country.
Regarding interpretation, caution is advised. First, NIQ has downstream effects on other variables, so controlling for them shrinks its direct effect. This is just a general feature of controlling for mediators in regression models. Second, while I included the top 30 esports games, it cannot be said this is properly representative. Japan, for instance, ranks relatively poorly (lowest among the high IQ Asians), but I don’t think they are bad at mental sports. Third, sampling error is a factor for smaller countries, their rankings could be different. Some small countries only have a few players even across 30 games, which can result in very unstable estimates. Fourth, this is more of an esports competitive performance index than an index of hypothetical performance if every country were to try equally hard at the same game (like an intelligence test). This is the same problem with looking at e.g. Math Olympiads. Humanity simply doesn’t have perfectly aligned interests in these games, so ranking humanity based on them has problems. Nevertheless, it is an indicator of national intelligence to do well on these kinds of indexes and it works reasonably well. Fifth, Nordics overperform as usual, and Norway is underperforming within that cluster, also as usual. Money does not buy many things. Sixth, because the top player rankings are based on money won, games played by rich countries automatically gets more top players indirectly. This of course confounds everything, but to an uncertain degree. Hypothetically, it is possible that there are some demanding cognitive esports that are popular in [poorly performing country] that isn’t showing up here because they don’t have big enough prize pools. There is no real way to deal with this problem, though, since controlling for GDPpc wouldn’t be causally interpretable either.
A fun aside, looking at the all-time top players we see:
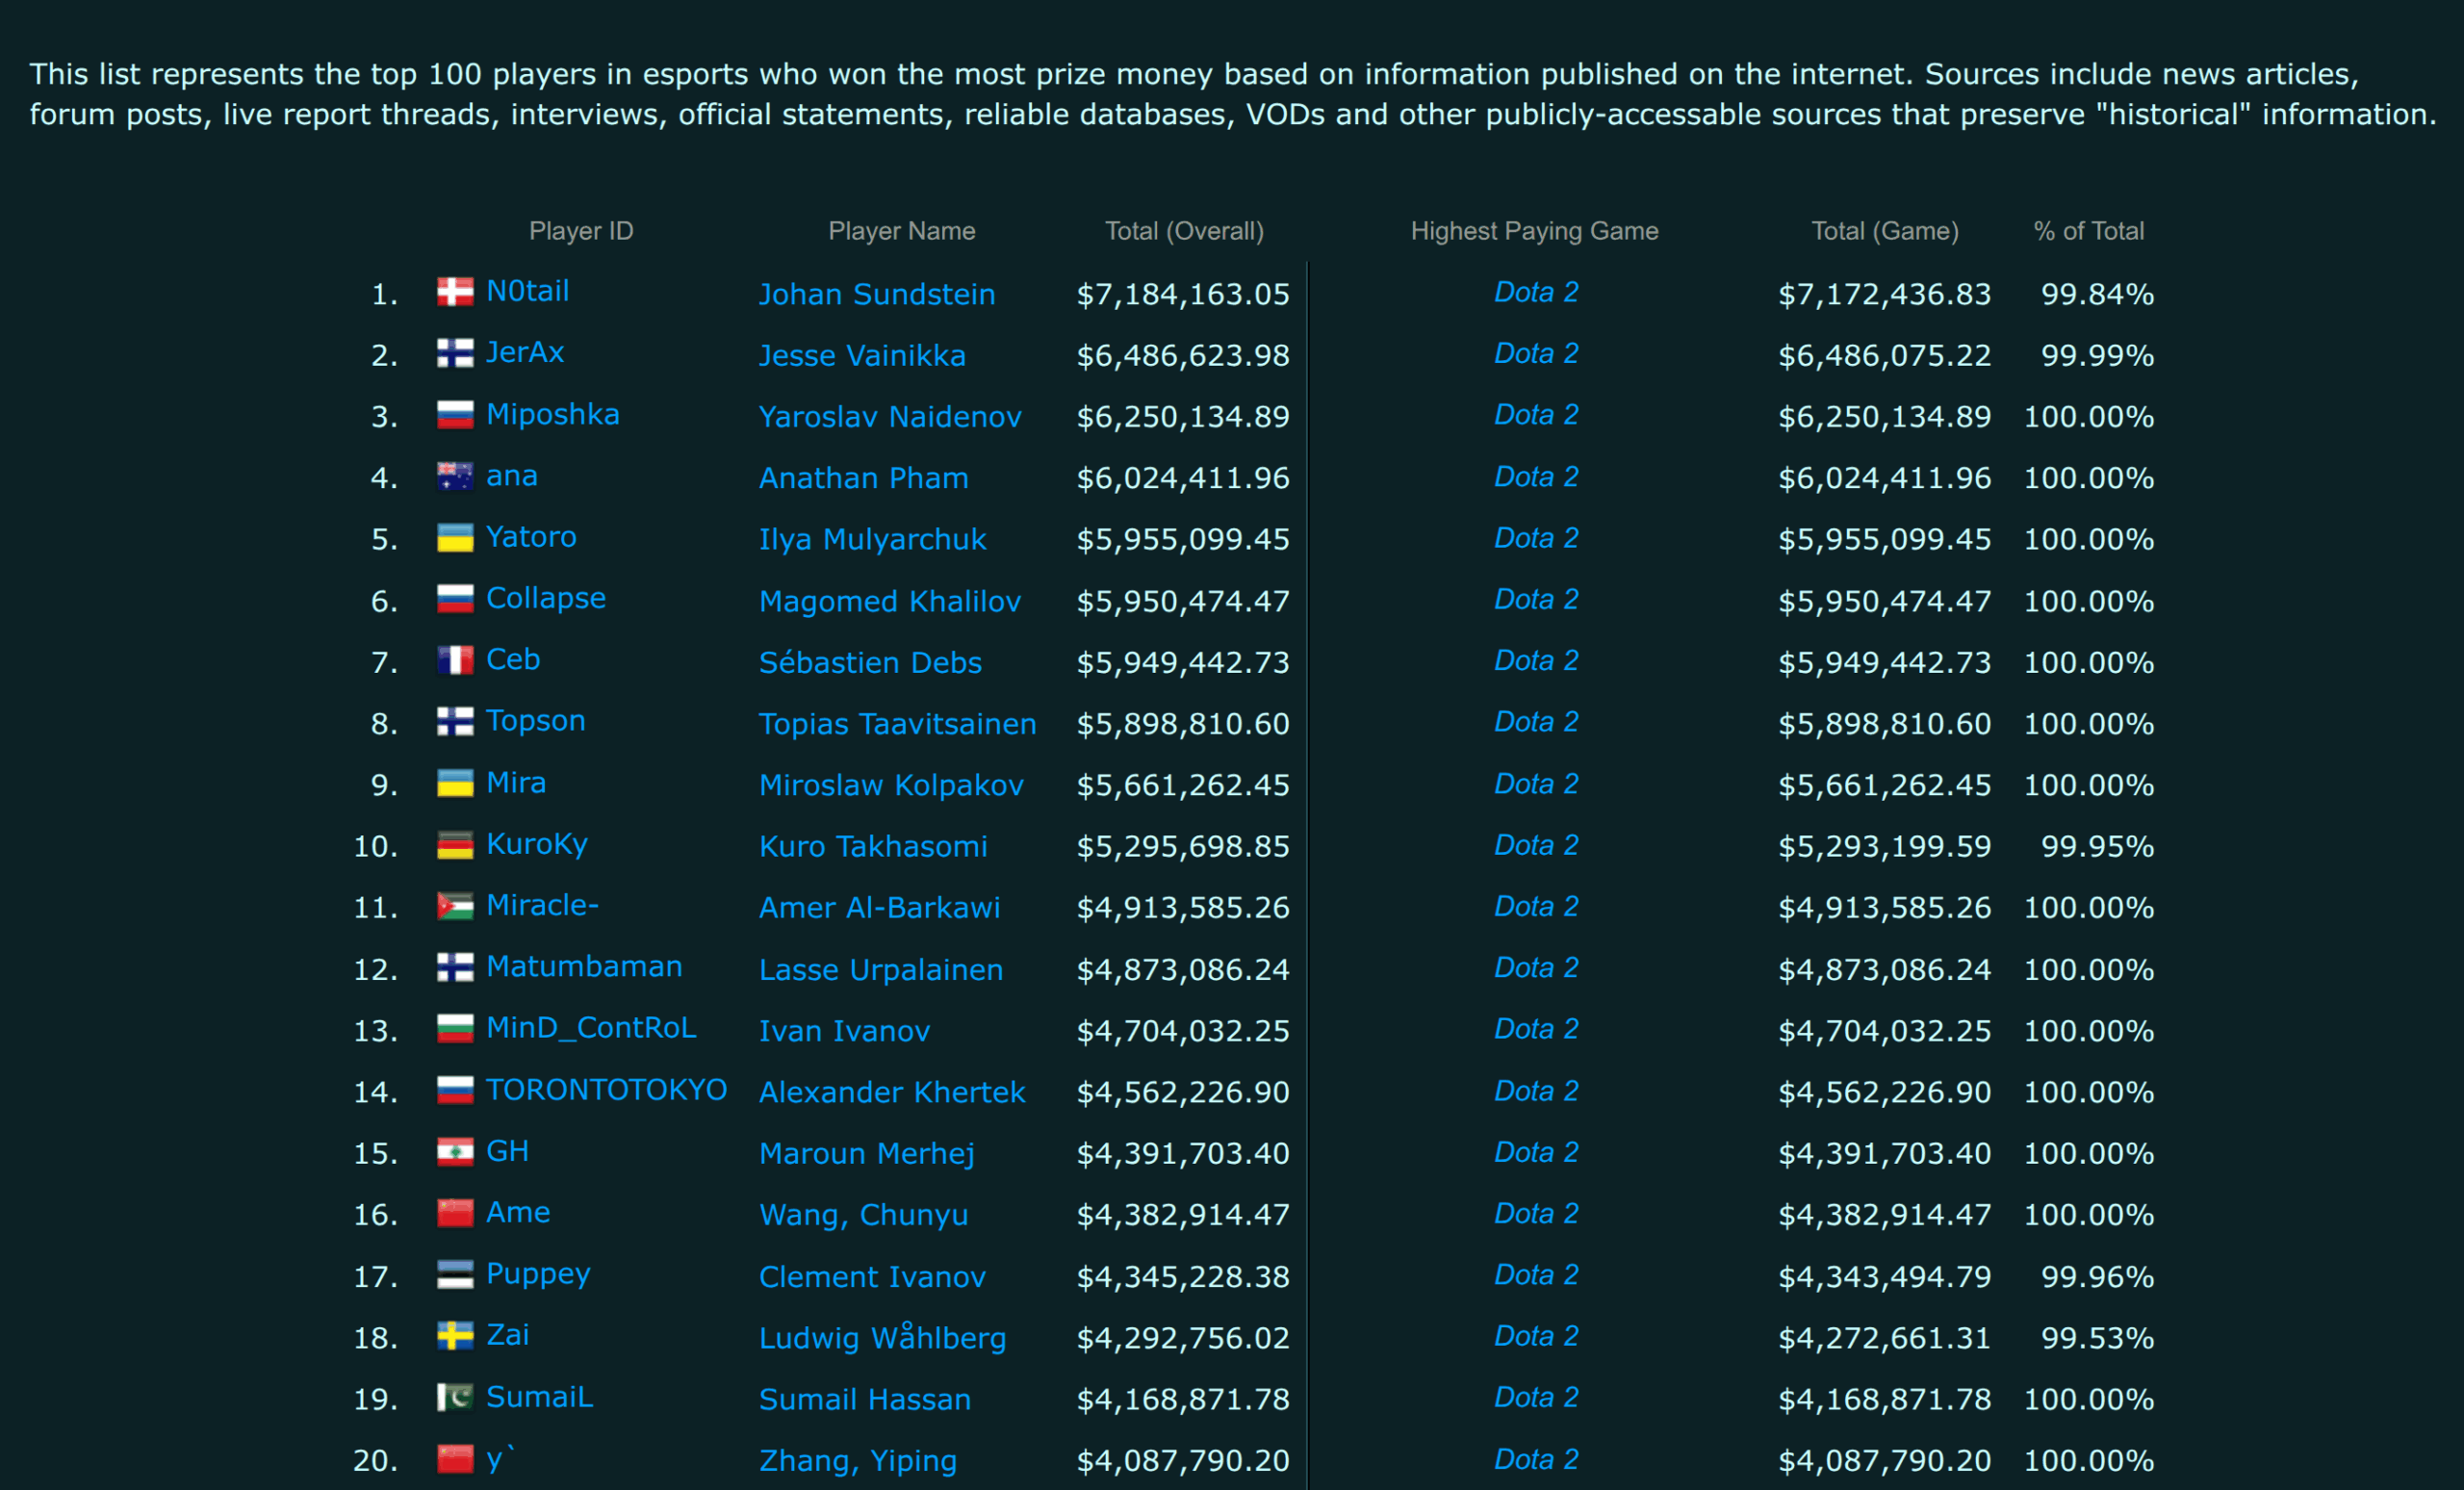
Notail is ostensibly Danish, but his surname seems not so Danish. Checking, he is actually of Faroese origin. If it was treated as a separate country (I merged subnational entities into parent countries), probably it would rank #1 by a large margin for winnings. Also amusingly, he is the grandson of a prior prime minister. Thus, itself, the top player illustrates the Galtonian finding that eminence runs in families.