It is common to talk about traits being monogenic or polygenic. We say that Sickle-cell disease is monogenic because its heritable variation among humans can be accounted for by a single locus of genetic variation. Or more accurately, we say that 100% of the heritable variation can be accounted for by variation in that genetic locus (assuming the simple monogenic scenario, I did not look into the details). We say that height is strongly or highly polygenic because it seems like we need thousands of locuses of genetic variation to account for the heritable variation among humans. The largest study that I know of, Wood et al 2014, identified 697 variants (with p < alpha) and these accounted for only about 20% of heritable variation in human height. Furthermore, as explored in a prior post, the distribution of effect sizes of variants follow a power law-like distribution. In the figure, the x-axis has the beta of the SNP, and the y-axis has the log10 of the frequency.
Due to the way statistical power works, we first find the variants with the largest effects. Making the assumption that we find the SNPs in the exact order of their effect size (only roughly true, empirically resolvable by those with access to data), we should be able to derive estimates of the number of SNPs needed to explain any given proportion of the heritable variation. Probably, we cannot estimate this with certainty if the proportion is set at 1 (100%), but we should be able to find decent estimates for e.g. 10%, 20% and 50%. Thus, we can introduce a specific measure of the degree of polygenicity: the number of variants needed to explain n% of the heritable variance. I propose the term n% genetic cardinality for this concept. This sets all the traits on the same scale and it should be calculable for any trait where there is a large GWAS.
An alternative measure would be to use the distribution parameters of the power law (or some other alternative, like negative binomial), but this would be more complicated to understand and estimate. The advantage is that it would be be less noisy. Can we estimate some numbers for a few traits just to showcase the concept? Perhaps. There are some traits where we have found SNPs that explain most of the variation. If we set n%=50, then we can find the values in papers discussing these traits perhaps.
Liu et al 2010 studied eye color in the Dutch and found that a 17 SNP model predicted about 50% of variance in a cross-validation sample. Actually, a single SNP accounted for ~46% variance in itself.

This means that for this trait, if we set n to be anything ~45 or below, the number will be 1. Most traits are not like this. However, I was not able to find more easy examples like this. Most studies just report a bunch of p-values which are near useless.
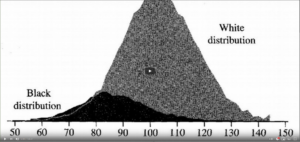
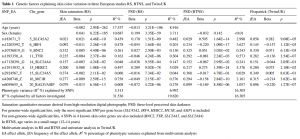
Liu et al 2015 report on skin color variation in Europeans and find that the top 9 SNPs explain 3-16% (depending on measure and sample).
 Bergholdt et al 2012 writes that “The estimated proportion of heritability explained by currently identified loci is >80%”. However, I could not find support for this in the given reference (Wray et al 2010). I could not even find the number of SNPs they are talking about.
What is needed is for researchers to publish plots that show cumulative R2 (explained variance, preferably in an independent sample) by number of SNPs in order of largest effect sizes (assuming no complicated inter-predictor relationship-related shenanigans…). This would allow for easy comparison of genetic cardinality of traits.
Comments
- If one looked at a broader sample (racial heterogeneous), the genetic cardinality numbers would be generally smaller. It is easier to explain variation between white and black hair of Europeans and Africans than it is to explain smaller differences between white and brown hair among Europeans. Thus, the population must be kept roughly constant for the numbers to be comparable.
- I don’t have time to try to figure out how to estimate the genetic cardinality from a published table of beta values. This should be possible if one is willing to make an assumption about the degree to which the effects are independent. I.e., one would first sort the SNPs by beta, then calculate the R2 values, then calculate the cumulative sum of R2s. Then fit the power law distribution to the number of SNPs used and the cumulative R2. This uses the assumption of no overlap in R2. The degree of overlap can be determined if one had access to case-level data, altho overlap in itself would be a function of of the number of SNPs. Complicated.
Update: Shi et al
These people actually did use a metric like I proposed.
- Shi, H., Kichaev, G., & Pasaniuc, B. (2016). Contrasting the genetic architecture of 30 complex traits from summary association data. The American Journal of Human Genetics, 99(1), 139-153.