I was skimming a Wikipedia article related to immigrant crime and came across an obscure Swedish language report from the 1990s:
-
Ahlberg, J. (1996). Invandrares och invandrares barns brottslighet: En statistisk analys [Immigrants’ and immigrants’ children’s crime: a statistical analysis]. Brottsförebyggande rådet (BRÅ).
This report is a goldmine. Briefly:
- Data from 1985-1989.
- Country of origin crime rates for 1st gen. Raw and adjusted for age and sex. n=38.
- Country of origin crime rates for 2nd gen. Raw and adjusted for age and sex.
- Stereotypes about immigrant crime levels. n=10 ethnicities.
- Data for different crime types: violent, property, sex, etc.
- Various other interesting things.
In this case, the old data are particularly useful because they allow us to examine whether recent wars etc. are responsible for poor performance of some groups. E.g. Iraqis usually do not perform well, but people will say it’s because their country got invaded by the US. Twice. And so they suffer from transgenerational epigenetic stress or whatever. And also had prolonged civil war. Similar things apply to Afghanistan and Yugoslavia.
The old data also allow for longitudinal analyses, which are very important to immigrant policy. I.e. if we can expect immigrants to acquire similar performance to natives after 20 years, then taking in poorly performing immigrants is only a temporary burden, not a permanent one.
Of the 38 cases, 34 are countries and 4 are unspecified remainder categories (e.g. “other European countries”). Of the country cases, some are combined, presumably due to small numbers. E.g. Argentina and Uruguay are combined. They are mostly combined sensibly by combining neighboring countries with similar cultures and genetics. E.g. there is a North African case with Algeria, Libya, Morocco and Tunisia. Perhaps the most problematic is the combination of Bangladesh and Pakistan. These are on different sides of India, which is included by itself. Both are mostly Muslim, but Bangladesh is mostly grouped with the other South Asian countries (Burma, Bhutan, Nepal) not with MENAP. In general, a sensible approach to these combined groups is to split them and use both countries as datapoints. This inflates the sample size a bit. One could weigh them accordingly when doing this to avoid this problem somewhat (i.e. weigh datapoints for Bangladesh and Pakistan by 0.5 vs. usual 1). After expanding the combined countries, we get a more respectable n=48. This still has a few former countries that are problematic: USSR, Yugoslavia, Czech Slovakia.
The stereotypes come from a large survey (n=1,362) and simple concern whether one thinks the 10 groups have more, same or fewer immigrants (5 options + don’t know). Similar to the data in this recent paper about the UK. Unfortunately, they don’t all match up with the immigrant groups, e.g. one group is gypsies. Gypsies have no country, so it is hard to get reliable data on them about any trait. However, if we match up 8 or 9 of the groups depending on our liberal we are. Depending on which, we get accuracy scores of r = .36 or .52. Not too bad. The groups are not random: all were above average, so there is variance reduction which reduces the observed correlation. But this is the best we can do.
[There is a meta-analysis of Roma IQ which found a mean of 74! Seems to be not published yet, but there’s an abstract from the talk.]
So, what are the basic findings? A scatterplot says a thousand words.
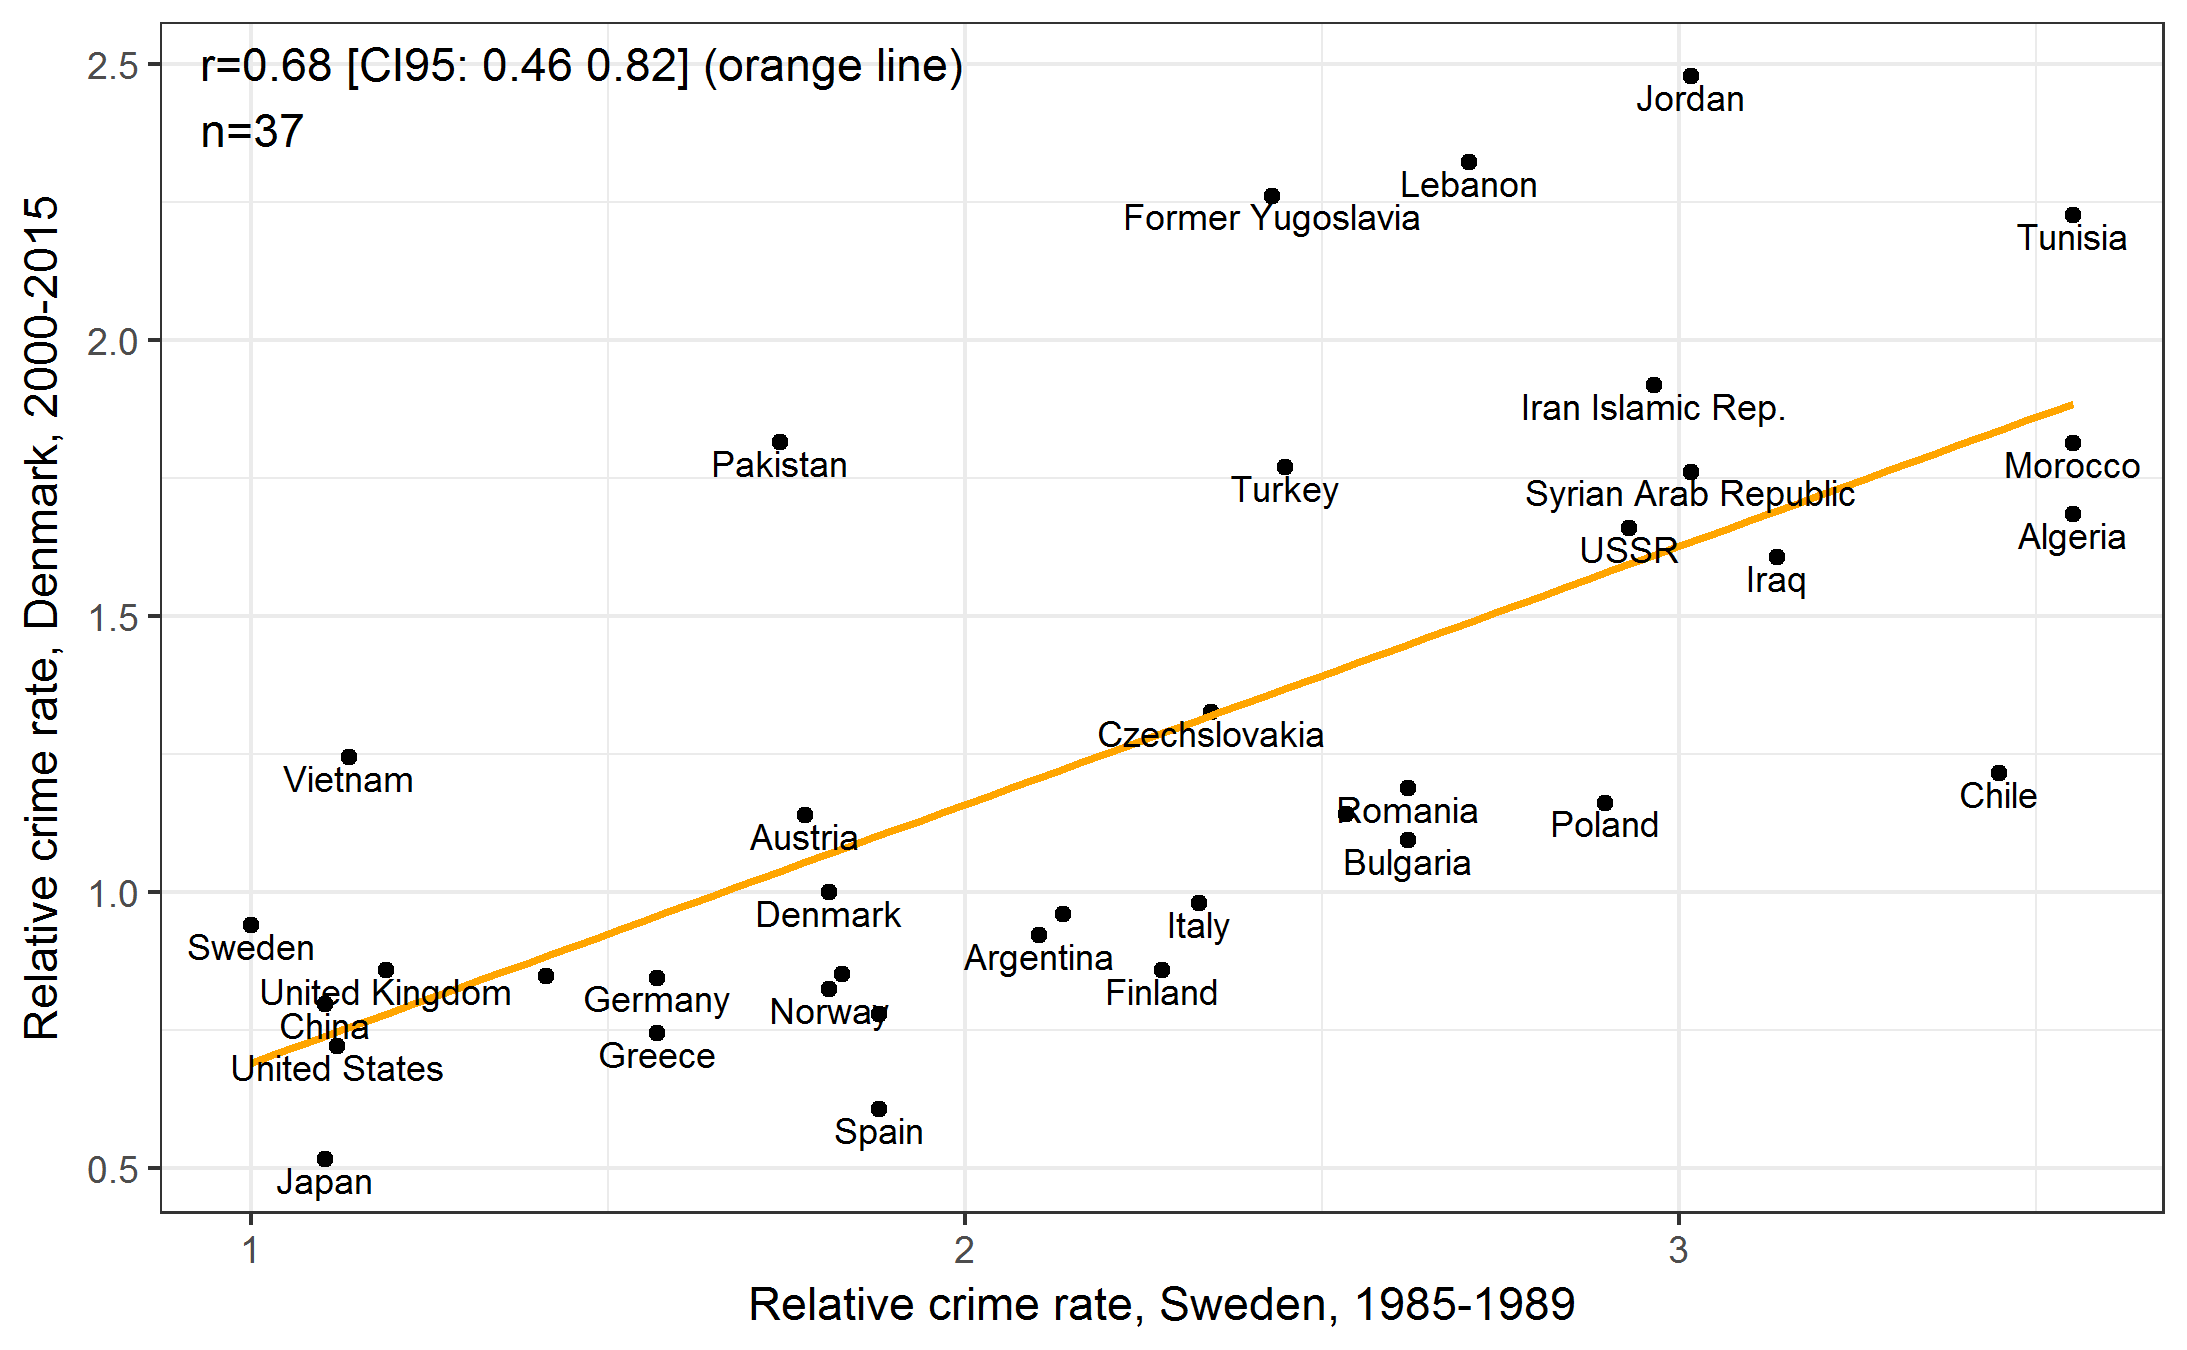


(all values adjusted for age and sex)
These subgroup rates should be taken very lightly because the samples must be very small indeed. Italians not known to be particularly crime prone.
More to come! We’re buying a large dataset for Sweden with immigrant performance data on 4 metrics: crime, education, income and social benefits. Then we will essentially replicate the Denmark and Norway analyses.