How easy is it to get provocative findings using mainstream methods published? Well, it depends on how provocative. Here’s a second round of generally nonsensical reviews for our PING paper (which you can read here and judge yourself: a good chunk of readers of this blog are themselves researchers and don’t need others to review for them!).
As I recall, Cochran and Harpending spent a few years getting their excellent Jewish paper out. Guess we’ll see how long this takes.
Copied verbatim.
Reviewer #1: MS#PAID-D-17-01184 “Bio-Ancestry, Cognitive Ability, and Socioeconomic Outcomes”
Reviewer #1
Comments for the Authors
This paper is so poorly written, peppered with a large number of unexplained and undefined acronyms throughout, that it is excruciatingly difficult to wade through the text and comprehend just what in the world the authors are attempting to do. But I surmise that the main goal of this paper is to introduce a new word “bio-ancestry” as something somehow different from race or ethnicity.
Rachel Dolezal notwithstanding, most (sane) people are aware of their ancestral background and perceive it accurately. So, for the most part, “bio-ancestry” and “self-identified race” are the same thing. And, quite remarkably, that’s exactly what the authors’ data show! Ancestors of most whites come from Europe, ancestors of most blacks come from Africa, and ancestors of most Asians come from Asia! How remarkable! Do we need quantitative data analyses to know whites are European in ancestral origin?
To make matters worse, while the concept of “bio-ancestry” is supposedly central to (and the primary raison d’être of) this paper, the authors do not at all explain how they measured it in their sample! The authors simply state that the data are “available,” without explaining how the variable was measured at all. Thus the central concept of the paper remains entirely mysterious.
So, when all is said and done, what the authors have managed to show with their (unexplained) data are: 1) there are race differences in intelligence; and 2) there are race differences in socioeconomic status. We have known both of these for at least half a century.
Contrary to what the authors may believe, race is not a “cultural identity” or a “social construction.” Race is a biological reality, and there are real, biological, genetic differences between races in all measurable quantitative traits. I would recommend that the authors stay away from the likes of Rachel Dolezal and introductory sociology textbooks, and familiarize themselves with scientific (not sociological) literature on race and race differences. There are observable race differences among human groups, because they separately evolved in different regions of the world. Race is not a social construction or a matter of self-identity (once again, contra Rachel Dolezal).
Reviewer #2: This article seeks to demonstrate that people of African descent have lower cognitive ability than people of European descent, and this difference has a genetic explanation. The authors utilize data from a separate study (Pediatric Imaging, Neurocognition, and Genetics) that collected cognitive test scores and “bio-ancestry” data from racially diverse 12 year-old children in several major urban areas in the US.
There are many flaws and omissions in this work that attempt to lead the reader to the notion that Europeans are genetically smarter than people of African descent – a notion that has been largely rejected by the mainstream scientific community. Given this fact, it is odd that the authors do not make a case at all for the importance of this work in the introduction. It remains unclear why this work would be important and how the research world could or should use the findings.
This paper is extremely weak scientifically. Beyond the questionable thesis of the study, I will describe the most egregious scientific problems below.
The authors admit that they did not adjust or weight the sample to be demographically representative, which is problematic given the sweeping and general conclusions made about entire ethnic groups. They also leave many gaps in the methodology and did not adequately describe the sample or how the sample was acquired. There should be a table of demographic information, by SIRE grouping, showing relevant data, such as parent’s education, SES, the 7 test scores, “g” as they compute it, etc. The authors speak at length about the relevance or non-relevance of these demographic factors, making it even more odd that the data is omitted, despite the fact that they include an excessive number of tables of alternate calculations. Because of the weakness of the methods section, we don’t know if there were biases in recruitment that differentially impacted the ethnoracial composition of the sample. It is well known that people of color may be underrepresented or overrepresented in
research studies for any number of reasons, and the authors do not mention this at all or make any attempts to correct for it.
According to the authors, “psych 1.6.9 (Revelle, 2017), factor analysis was used to extract a g factor from the cognitive data (Jensen, 1998). Using this method, g scores for 1,369 individuals were derived.” The seven cognitive tests used to compute g were: Dimensional Change Card Sort Test (Card Sort); Flanker Inhibitory Control and Attention Test (Flanker); Picture Sequence Memory Test (Picture Sequence); Pattern Comparison Processing Speed Test (Pattern Recognition); Oral Reading Recognition Test (Pattern Recognition); List Sorting Working Memory Test (List Sort); and Picture Vocabulary Test (Vocabulary).
However, the authors need to provide some legitimate precedents (peer-reviewed papers) to show that those 7 tests are a legitimate means of computing “g”. Most scholars recognize that intelligence is multidimensional, so there is a problem with assigning it a single numerical value without any justification for this approach. They also need to give more description and explanation for their approach to finding “g,” backed up by peer-reviewed sources, rather than drowning readers in pages of supplementary data tables. It looks like they just made up this method on their own.
Additionally, the authors do not report any psychometric data on the 7 tests. It would be important to describe the validity of these scales for each of the ethnic groups examined, and describe the tests norms for those groups. It is possible that adjustments may be required by group (for example IQ tests are frequently gender normed). If the test has not been validated on any of the groups under study, then that should be listed as an important limitation to the study. The author’s also need to consider that any test of cognitive ability or IQ will reflect that culture’s priorities and markers of what they consider intelligent behavior. Therefore, it is not accurate to refer to the test results or their determination of “g” as a “cognitive ability,” rather they should simply call it “test performance.”
The ethnicity of the person giving the test to the child was not reported. Any person doing trace and ethnicity research should be aware of the literature showing that a cultural mismatch can affect outcomes/scores. If all the testers were European American, then we would expect a bias in test scores in favor of European American children. Likewise, if all the tests were given in English, we’d expect lower scores among those for whom English is a second language. The authors attempt to control for language with a single dummy variable, but a continuous measure of English exposure would be more appropriate. Finally, stereotype threat also needs to be considered and controlled for in any study of race and IQ (Steele & Aronson, 1995), and this concept was not even mentioned in the paper.
In general, there are too many redundant tables and analyses. The authors should choose those that are most salient rather than dumping so many analyses on the reader, and better explain their results so that exhaustive figures and tables are not needed.
One strength of the paper is that the authors have attempted to disentangle culture from race using SIRE and genetic data. However, these variables are not independent. More African genes lead to both darker skin and classification in a non-White ethnic group, and both lead to discrimination and fewer opportunities, which leads to lower income, which leads to poorer nutrition and fewer educational opportunities, which leads to lower test scores. So, the fact that both SIRE and genetic data both find lower test scores in children is not unexpected or extraordinary.
Previous studies have used blood markers to estimate the percentage of European in a Black child’s family tree and no correlation was found between the number of “European” blood markers and IQ. When ‘Black genes’ are not visible to the naked eye and are not associated with membership in a Black community, they do not have much effect on young children’s test scores. Growing up in an African American rather than a European American family substantially reduces a young child’s test performance. When Black Americans raised in White families have higher IQ scores, but when they reach adolescence, their test scores fall, indicating differences are environmental, not genetic. The authors do not discuss the discrepant findings of other researchers, and how this fits with the current study.
Most egregiously, the authors wrongly dismiss the well-known harms of racism. They state “it is not clear that race-phenotype discrimination is actually a potent force in the US,” despite a plethora of findings to the contrary from the NSAL epidemiological study of Black Americans and others. The only source given for their fantastic notion about the non-harm caused of discrimination is research by Mill and Stein (2016), which actually shows the opposite of what they claim (e.g., light-skinned Blacks who choose to pass as Whites make more money than those who choose not to).
They also wrongly state, “it is unlikely that such discrimination, which is typically envisioned as market-based, could directly lead to the association between ancestry and cognitive ability, given the ages of the participants.” Classic research first published by Clark and Clark (1939; doll studies) show that even children are aware of racial hierarchies and preferences, and these studies have been replicated in recent times. Children as young as six years old are aware of race and start to show implicit bias (Baron & Banaji, 2006). Thus, the authors need to acknowledge the negative impact of being a stigmatized minority child in a socioracial hierarchy.
Further, they state “it is unlikely that e.g., European ancestry would be related to SES among native Mexicans and native Puerto Ricans” without any citations. It seems like the authors must not be very knowledgeable diversity researchers if they are unaware of colorism rampant in those societies. In the manuscript, too many claims like this are not backed up with peer-reviewed research or any citations at all.
The authors make are extraordinary claims, and such claims require extraordinary data. These findings are predictable and actually tells us nothing about cognitive ability and race. Furthermore, the authors fail to provide an adequate review of the literature, and do not even acknowledge alternative explanations such as stereotype threat, or the fact that individuals living in minority and/or low income communities may be exposed to lead and other toxins that influence cognitive functioning more than others. There is literature on how poor maternal nutrition during pregnancy can influence children’s brain development, which is also not mentioned.
The authors need to reconcile their findings with established research on racial issues like stereotype threat, achievement gaps, racial discrimination, structural racism, and colorism, before resorting to unsound and largely debunked theories about genetic racial inferiority/superiority.
Reviewer #3: Given the march of research over the past 20 years or so into the impact of genetics on group mean differences in intelligence, it was inevitable that this manuscript was going to be written. I think that the manuscript should be published eventually, but there need to be some moderate changes in the manuscript before it is fully acceptable.
Major issues:
* I thought that the intercorrelations in Table 1 looked weak compared to most cognitive test batteries. My suspicions were confirmed in Table S14, which seems to indicate that the general cognitive ability factor seems to have captured 26% of variance. (In contrast, the socioeconomic status seems to have captured 63% of variance, according to Table S17.) This is much less than what is usually captured by g, and the authors need to state this.
* Yes, the reliability of the g factor scores is probably high, but is there any information about the reliability of the factor’s constituent tests? If so, please provide this information.
* In the first paragraph of p. 14, the authors summarize their data from Tables 7-10 and S1-S4. Some of their summaries (e.g., range of Central Asian betas for socioeconomic outcomes) do not seem to match the data in the tables. The authors need to double-check all the numbers in this summary.
* One reason that SIRE is an inferior predictor to genomic ancestry is undoubtedly statistical. SIRE is a dichotomous variable, while genomic ancestry is continuous. Nominal variables almost always have more variability and statistical power than continuous variables. The authors should discuss this.
* I would like the authors to highlight some of the anomalies in more in depth. For example, Table 16 might indicate that SIRE is a better predictor of cognitive ability for Hispanics than genomic ancestry, which is not in line with the other results. Also, a discussion of the inconsistent East Asian results should be expanded on.
Minor issues:
* Similar prior research (e.g., Fuerst & Kirkegaard, 2016) has all been conducted at the national or subnational level—not with individual data. Skeptics of genetic hypotheses of group mean differences could state that past studies suffered from the ecological fallacy. The current study overcomes the shortcomings of past work, and the authors should state this.
* Please elaborate more on the “logic [that] has been intricately detailed by Templeton (2001)” (p. 4, lines 69-70).
* The authors should also explain the factor analysis better. What is the extraction method? Did the authors do any factor rotation?
* I agree with the author’s use of the EFL variable. But please provide information about which cognitive tests would require English mastery.
* Please don’t use the phrase “coefficient of determination” for r2. The r2 statistic is just a correlation coefficient squared. Because correlation is not causation, the phrase implies that one variable causes the other.
* I’m thankful for the authors’ concern about research degrees of freedom. To fully rest any concerns, please indicate the standards by which “. . . ancestry components with high standard errors were not dropped” (p. 11, lines 233-234).
* Tables 7-10 would be easier to read if the independent variables were always in the same order.
* Ranges are typically reported from minimum to maximum, but many ranges are reported in the reverse order, which is awkward.
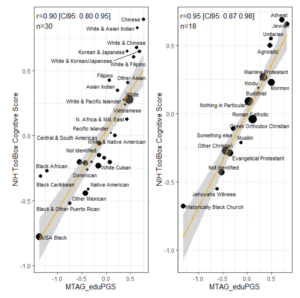
* Figure 1 would be easier to read if the dependent variables were a table heading, instead of a right axis label.
* Please revise “validity” on p. 15, line 288 to “predictive ability.” The term “validity” has too many meetings to be exact enough in this context.
* Independent variables in Tables 11, 12, 15, 16 are not clear. Which variables are SIRE variables?
* Please eliminate the phrase “. . . and well beyond chance levels” (p. 21, line 370). Statistical significance can be caused by more than just “chance.”
* The “market-based” phrase on p. 24 needs to be explained more clearly.
* In Table S11, what does the unlabeled column (with rows numbered 1-6) mean? I think it’s just extraneous information, but I’m not sure.