Anon asks:
Do you have the study where they compare meta analysis to pre-registered trials
So the idea is that we know that research that isn’t (pre-)registered is to some extent biased in the direction the authors want, usually towards proving whatever association they like (but sometimes disproving it too). So if we want to avoid this bias, we want to look at studies where this kind of bias is reduced. The best method for this is to rely on studies where the methods were set out before the data were analyzed. Indeed, we want to rely on a meta-analysis of such registered studies. As you can imagine, there are not so many of these in science. But there are some. An example is the Many Labs series of replications. In this setup, many teams decide on a study (or multiple studies), and then each of them runs their own replication, which follows the same protocol and analysis plan. Finally, a meta-analysis of the replications is conducted, which puts us at the top of the hierarchy above. These kind of efforts usually show that a large proportion of initial findings were not true and the rest usually grossly overestimated (Many Labs 2):
We conducted preregistered replications of 28 classic and contemporary published findings, with protocols that were peer reviewed in advance, to examine variation in effect magnitudes across samples and settings. Each protocol was administered to approximately half of 125 samples that comprised 15,305 participants from 36 countries and territories. Using the conventional criterion of statistical significance (p < .05), we found that 15 (54%) of the replications provided evidence of a statistically significant effect in the same direction as the original finding. With a strict significance criterion (p < .0001), 14 (50%) of the replications still provided such evidence, a reflection of the extremely high-powered design. Seven (25%) of the replications yielded effect sizes larger than the original ones, and 21 (75%) yielded effect sizes smaller than the original ones. The median comparable Cohen’s ds were 0.60 for the original findings and 0.15 for the replications. The effect sizes were small (< 0.20) in 16 of the replications (57%), and 9 effects (32%) were in the direction opposite the direction of the original effect. Across settings, the Q statistic indicated significant heterogeneity in 11 (39%) of the replication effects, and most of those were among the findings with the largest overall effect sizes; only 1 effect that was near zero in the aggregate showed significant heterogeneity according to this measure. Only 1 effect had a tau value greater than .20, an indication of moderate heterogeneity. Eight others had tau values near or slightly above .10, an indication of slight heterogeneity. Moderation tests indicated that very little heterogeneity was attributable to the order in which the tasks were performed or whether the tasks were administered in lab versus online. Exploratory comparisons revealed little heterogeneity between Western, educated, industrialized, rich, and democratic (WEIRD) cultures and less WEIRD cultures (i.e., cultures with relatively high and low WEIRDness scores, respectively). Cumulatively, variability in the observed effect sizes was attributable more to the effect being studied than to the sample or setting in which it was studied.
So, about half the findings they studied replicated, and on average, the effect sizes were 25% of the original ones reported (i.e., 75% smaller!). Yikes!
Moving back to the question from Anon, what about if we only have a single registered study and a meta-analysis of unregistered studies? Which is the best estimate of the truth? It depends on the sample size of the registered study, but assuming it is large (usually they are), probably you should trust it over the meta-analysis of older work with known bias. Ideally, we would have some situations where we could verify this standard. To be precise: we need two meta-analyses of an effect or association. One is based solely on registered studies, the other solely on unregistered studies. Then we check whether picking a random single registered study gets us closer to the grand truth from the meta-analysis of registered studies than the meta-analysis of unregistered studies. I don’t think this exact study has been conducted anywhere, but there’s this meta-analysis:
- Kvarven, A., Strømland, E., & Johannesson, M. (2020). Comparing meta-analyses and preregistered multiple-laboratory replication projects. Nature Human Behaviour, 4(4), 423-434.
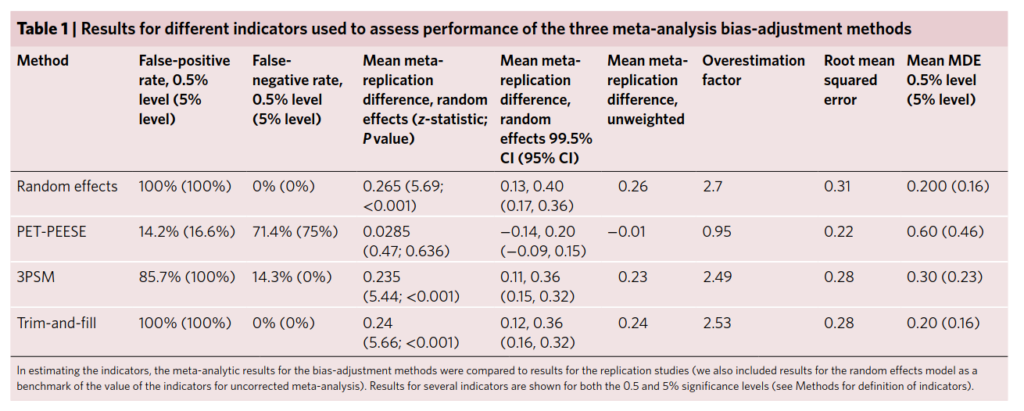
Many researchers rely on meta-analysis to summarize research evidence. However, there is a concern that publication bias and selective reporting may lead to biased meta-analytic effect sizes. We compare the results of meta-analyses to large-scale preregistered replications in psychology carried out at multiple laboratories. The multiple-laboratory replications provide precisely estimated effect sizes that do not suffer from publication bias or selective reporting. We searched the literature and identified 15 meta-analyses on the same topics as multiple-laboratory replications. We find that meta-analytic effect sizes are significantly different from replication effect sizes for 12 out of the 15 meta-replication pairs. These differences are systematic and, on average, meta-analytic effect sizes are almost three times as large as replication effect sizes. We also implement three methods of correcting meta-analysis for bias, but these methods do not substantively improve the meta-analytic results.
Here we also see that the methods for correcting existing meta-analyses are not sufficient:
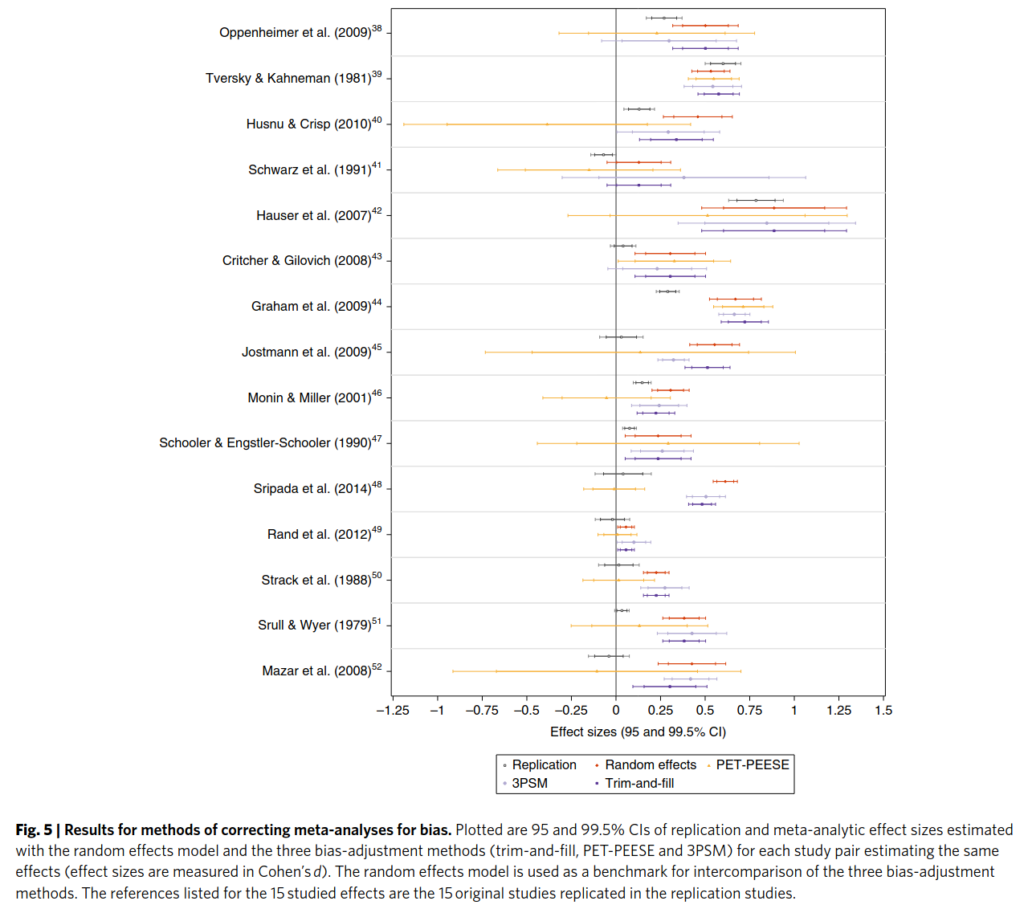
The black line is the meta-analysis of registered trials, the gold standard. The red line is the standard meta-analysis of old studies, no correction for bias. The other colors are methods for dealing with bias. As can be seen, the other colors do not generally get results similar to the black lines, so they are insufficient for dealing with bias in the literature. The least wrong correction method is PET-PEESE (yellow), but as can be seen, it makes confidence intervals very large, so in practice, it is not very useful.
Finally, there’s a large meta-analysis of money priming studies:
- Lodder, P., Ong, H. H., Grasman, R. P. P. P., & Wicherts, J. M. (2019). A comprehensive meta-analysis of money priming. Journal of Experimental Psychology: General, 148(4), 688–712. https://doi.org/10.1037/xge0000570
Research on money priming typically investigates whether exposure to money-related stimuli can affect people’s thoughts, feelings, motivations, and behaviors (for a review, see Vohs, 2015). Our study answers the call for a comprehensive meta-analysis examining the available evidence on money priming (Vadillo, Hardwicke, & Shanks, 2016). By conducting a systematic search of published and unpublished literature on money priming, we sought to achieve three key goals. First, we aimed to assess the presence of biases in the available published literature (e.g., publication bias). Second, in the case of such biases, we sought to derive a more accurate estimate of the effect size after correcting for these biases. Third, we aimed to investigate whether design factors such as prime type and study setting moderated the money priming effects. Our overall meta-analysis included 246 suitable experiments and showed a significant overall effect size estimate (Hedges’ g = .31, 95% CI [0.26, 0.36]). However, publication bias and related biases are likely given the asymmetric funnel plots, Egger’s test and two other tests for publication bias. Moderator analyses offered insight into the variation of the money priming effect, suggesting for various types of study designs whether the effect was present, absent, or biased. We found the largest money priming effect in lab studies investigating a behavioral dependent measure using a priming technique in which participants actively handled money. Future research should use sufficiently powerful preregistered studies to replicate these findings.
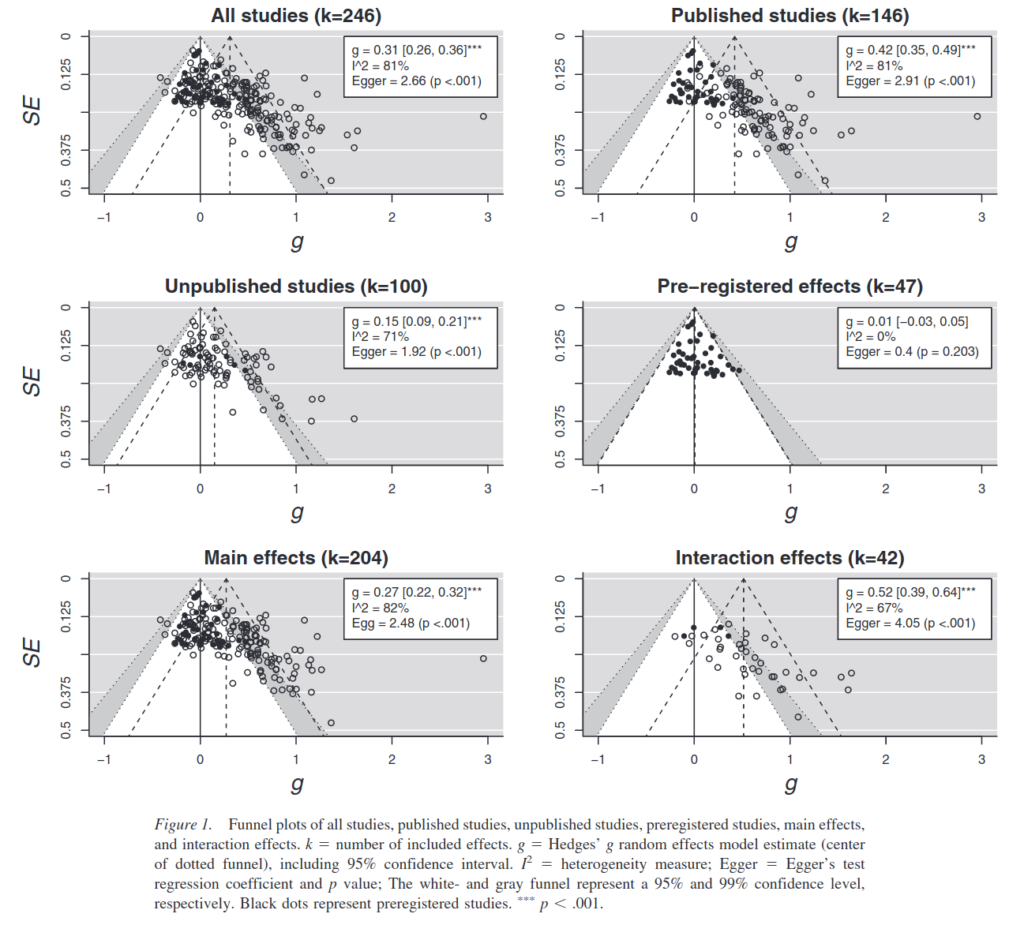
This study provides us with exactly what we want in terms of data. The question then is: if we picked random studies from the collection of 47 registered studies (middle right), how often would we get it more right than the meta-analysis of unregistered studies (top left, but imagine the black dots are not visible)? We can’t say exactly from this plot, but it appears even smaller registered studies are more likely to be right. Fortunately, the data from this meta-analysis is public, so I downloaded it…
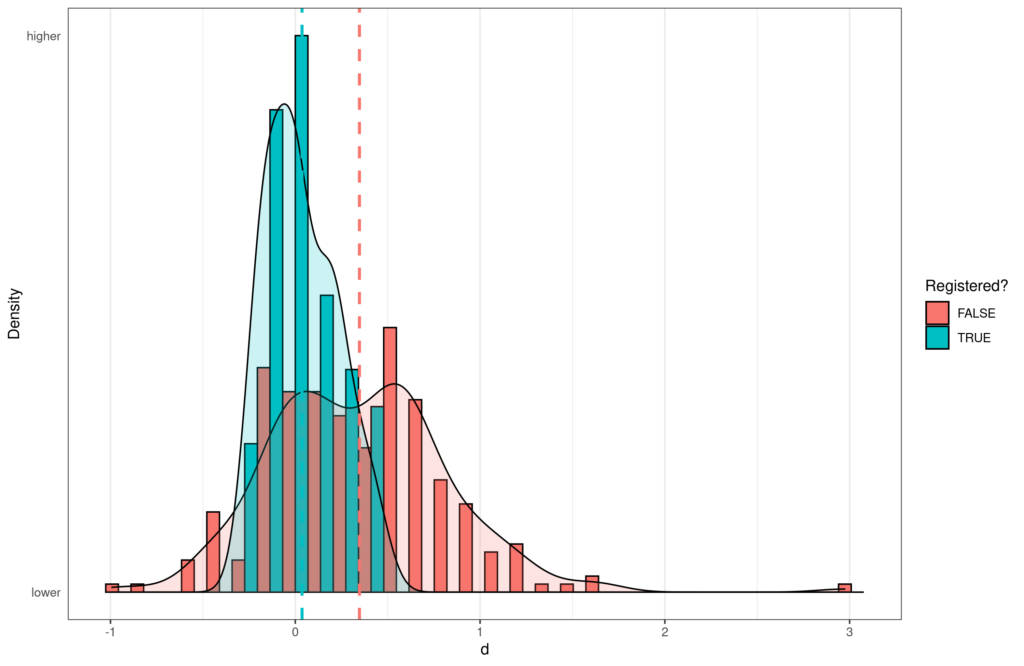
The distributions of effect sizes by registration status.
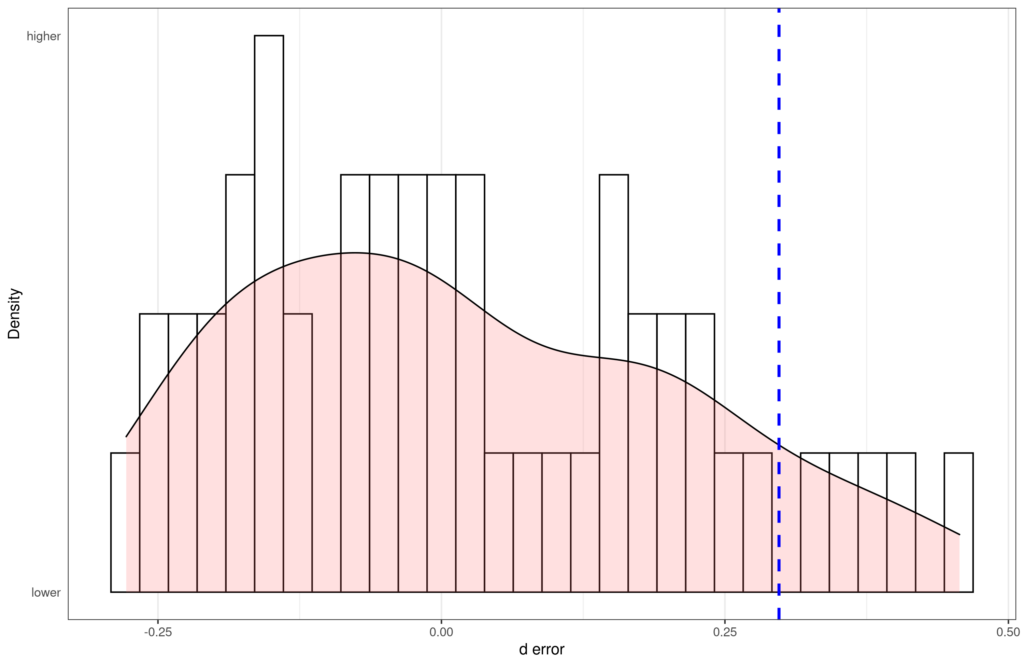
We take the results of the meta-analysis of registered studies as the gold standard (d = .02). Using this, we compute the error of each individual study (how far off the estimate of that study is to the gold standard). The blue line shows the meta-analysis of unregistered studies, which is quite far off. There are 51 registered studies. As we can see on the plot, only 5 of these are more off to the right (found a stronger effect) than the meta-analysis of unregistered studies. Thus, there’s about 90% chance the meta-analysis of unregistered studies is more wrong than a single random replication study. If we do this analysis but disregard the direction of effect, the answer is the same. Details can be found on Rpubs: https://rpubs.com/EmilOWK/meta_vs_registered.
PS. If you are wondering why my reanalysis has n=51 vs. n=47 above, it is because the authors excluded a few studies because they were based on interaction effects. Their own analysis shows this doesn’t matter (Appendix A in their paper).