The Flynn effect is famously the result that IQ scores seem to keep going up. That is, at least, they did so from 1917 until 2010 or so (when decline actually set in, but maybe just due to immigration of below average intelligence peoples; see here for contrary and rather mysterious results). Why is it a paradox? At the same time as IQs were going up, smarter people were having fewer children, and we can see the polygenic scores for education are declining, so IQ scores should be going down not up, insofar as genetics is concerned. This result has perplexed the intelligence research community for some decades. In fact, if we go back to the first part of 1900s, intelligence researchers such as Raymond Cattell made strong predictions that intelligence was quickly declining. I reviewed one of his books previously, so check that out for quotes. Later in the 1930-40s (Runquist 1936; Tuddenham 1948), the first good data came in from actual IQ tests which showed that scores were going up, and kinda fast too! Though James Flynn did not discover the Flynn effect, in the 1980s he brought renewed attention to this trend, and related it do the causes of race differences in intelligence. This got a lot of attention, getting his named attached to this pattern (Stigler’s law confirmed). Lynn 2013 has the history for those who are more curious. This incongruity between the fertility data and the IQ score secular increase was then labelled Cattell’s paradox (e.g. Falek 1973, also the works by Reed).
There’s two general solutions to this kind of problem:
- Claim that measurements are not invariant over time, e.g., even though IQ scores are going up, intelligence is really not, it’s a measurement problem
- Claim that non-genetic effects are stronger than genetic effects for the trait in question, at least when it comes to generational changes
The first solution is really only convenient for certain suboptimal metrics that are not ratio scale to begin with, but something weaker. For instance patent rates are often used as proxies for innovation rates, but changes to patent laws over time can change this relationship, invalidating cross-temporal measurement properties. Indeed, (1) is the most popular solution to the Flynn effect. The point being that if intelligence really was going up and measurements were invariant, then the best measures should be going up faster than the worst measurements, all else equal. We find that empirically this is actually not the case at all. In psychometric language, the Flynn effect is anti-g-loaded, that is, there is a negative relationship between a test’s g loading and it’s secular change. There’s also some quite basic tests that do go down over time, famously reaction times and color acuity.
But one could also claim that intelligence is actually going up for reals, and that this is because our environment is getting better faster than the genetic basis is declining. This is not so outlandish because the correlation of fertility and intelligence is something like -.11, which is quite weak indeed, and would only lead to a small decline over the roughly 100 to 150 years we think there has been selection against intelligence in Western countries. So if there was some environmental factor that improved more over time, or a set of them improving enough taken together, that would suffice to overwhelm the genetic decline. The goal of much Flynn effect research has been to find such candidate environmental factors. There are several reviews of these attempts. My reading is that the most obvious candidates are not so plausible on a closer look. The most obvious first: education! Education has increased a lot in duration since the late 1800s, so one might that think this extra stimulation or brain-training would lead to more intelligence. This is bolstered by research showing evidence that education does boost IQ scores, at least, but maybe not intelligence itself. The trouble with this is that young children and older adults seem just as effected by the Flynn effect. Education cannot explain this pattern, as these are too young or too old to receive any benefits of longer formal education. One can go over the other proposed solutions and the only one that really works across the board is nutrition or health. Health/nutrition is a good fit because it affects persons of all ages no matter their time of birth. The model was proposed by none other than arch-hereditarian Richard Lynn! (Who also pointed out the Flynn effect before Flynn.) Still, it’s an unsatisfactory solution too because it’s not specific enough. What aspects of health and nutrition? As we saw in a recent post, it’s probably not much due to lead, but maybe some of it is. Essentially all attempts at boosting intelligence for people who are not obviously malnourished have failed (best we have is iodine supplements for those who need them).
Anyway, so this Flynn effect debate of whether intelligence is going up or not has not really been resolved because while one can prove that measurement invariance does not hold, this doesn’t provide any explanation for why some aspects of intelligence increase while others don’t. It just says we can’t compare the overall IQ scores over time. Maybe someone can show that even a given test is not measurement invariant over time, say, Raven’s matrices doesn’t even tap into the same abilities over time consistently. I don’t know of any such studies unfortunately. One attempt at side-stepping this issue is to look at brain volume over time (brain volume has ratio scale measurement), but it’s also increasing, so there is no easy way out there.
While a lot of interest is in intelligence because it’s the most important human trait (species literally named after it), there are in fact a number of other phenotypes that (maybe) show such paradoxical patterns. I attempt a summary of them here.
Mental illness
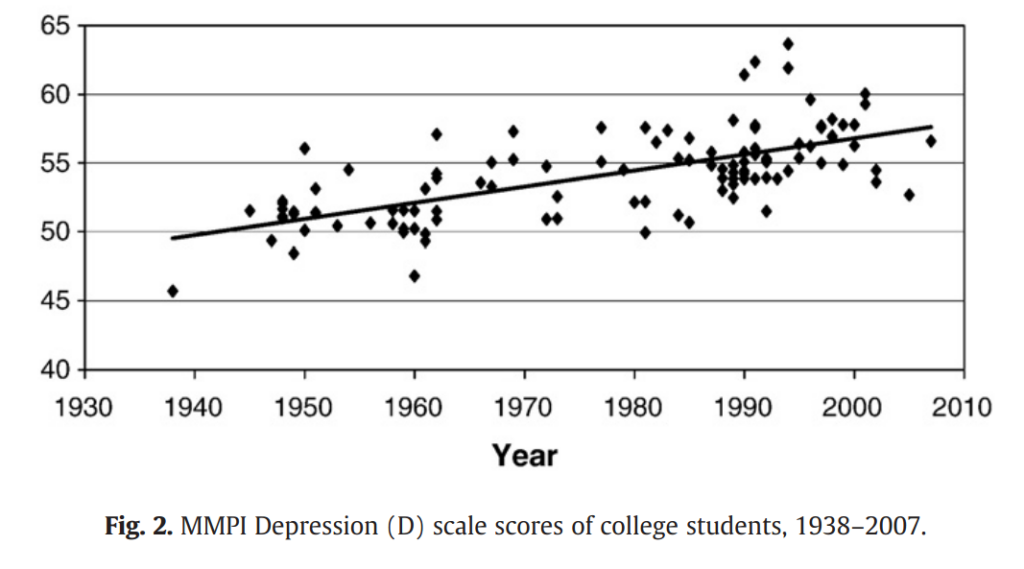
Mental illness rates are increasing, especially among the white lefties. One study analyzing long-running student samples finds this pattern (Birth cohort increases in psychopathology among young Americans, 1938–2007: A cross-temporal meta-analysis of the MMPI, 2010):
Two cross-temporal meta-analyses find large generational increases in psychopathology among American college students (N = 63,706) between 1938 and 2007 on the MMPI and MMPI-2 and high school students (N = 13,870) between 1951 and 2002 on the MMPI-A. The current generation of young people scores about a standard deviation higher (average d = 1.05) on the clinical scales, including Pd (Psychopathic Deviation), Pa (Paranoia), Ma (Hypomania), and D (Depression). Five times as many now score above common cutoffs for psychopathology, including up to 40% on Ma. The birth cohort effects are still large and significant after controlling for the L and K validity scales, suggesting that the changes are not caused by response bias. The results best fit a model citing cultural shifts toward extrinsic goals, such as materialism and status and away from intrinsic goals, such as community, meaning in life, and affiliation.
The plot for the depression scale looks like this:
There’s other data, but it’s probably not in doubt that mental illness is going up, though measurement invariance has probably not been established (let me know if you find a study).
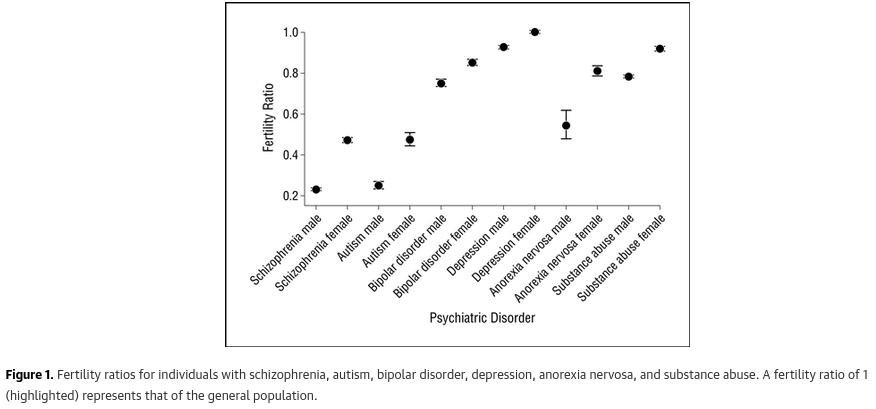
Fertility rates are lower in people with formal diagnoses of mental illness. The best study around is this Swedish one (Fecundity of Patients With Schizophrenia, Autism, Bipolar Disorder, Depression, Anorexia Nervosa, or Substance Abuse vs Their Unaffected Siblings, 2013):
Context It is unknown how genetic variants conferring liability to psychiatric disorders survive in the population despite strong negative selection. However, this is key to understanding their etiology and designing studies to identify risk variants.
Objectives To examine the reproductive fitness of patients with schizophrenia and other psychiatric disorders vs their unaffected siblings and to evaluate the level of selection on causal genetic variants.
Design We measured the fecundity of patients with schizophrenia, autism, bipolar disorder, depression, anorexia nervosa, or substance abuse and their unaffected siblings compared with the general population.
Setting Population databases in Sweden, including the Multi-Generation Register and the Swedish Hospital Discharge Register.
Participants In total, 2.3 million individuals among the 1950 to 1970 birth cohort in Sweden.
Main Outcome Measures Fertility ratio (FR), reflecting the mean number of children compared with that of the general population, accounting for age, sex, family size, and affected status.
Results Except for women with depression, affected patients had significantly fewer children (FR range for those with psychiatric disorder, 0.23-0.93; P < 10−10). This reduction was consistently greater among men than women, suggesting that male fitness was particularly sensitive. Although sisters of patients with schizophrenia and bipolar disorder had increased fecundity (FR range, 1.02-1.03; P < .01), this was too small on its own to counterbalance the reduced fitness of affected patients. Brothers of patients with schizophrenia and autism showed reduced fecundity (FR range, 0.94-0.97; P < .001). Siblings of patients with depression and substance abuse had significantly increased fecundity (FR range, 1.01-1.05; P < 10−10). In the case of depression, this more than compensated for the lower fecundity of affected individuals.
Conclusions Our results suggest that strong selection exists against schizophrenia, autism, and anorexia nervosa and that these variants may be maintained by new mutations or an as-yet unknown mechanism. Bipolar disorder did not seem to be under strong negative selection. Vulnerability to depression, and perhaps substance abuse, may be preserved by balancing selection, suggesting the involvement of common genetic variants in ways that depend on other genes and on environment.
Results visually:
And their siblings without diagnoses:
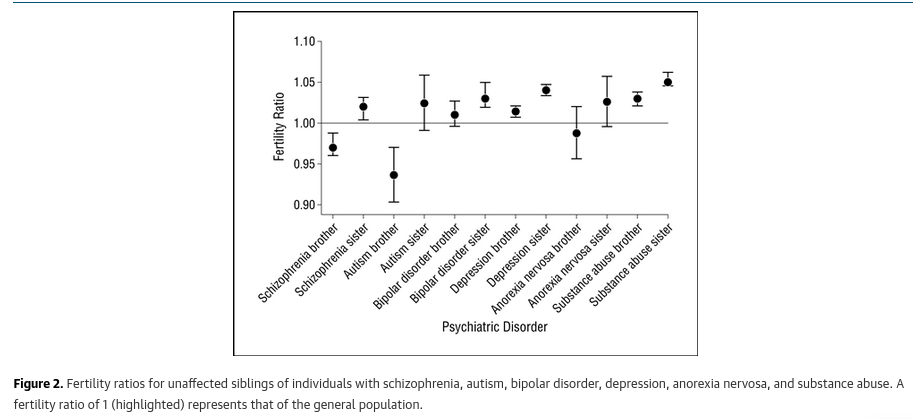
Overall, we see that many disorders are themselves negative, but their siblings are usually above average. Since siblings are highly correlated for P factor, this suggests a nonlinear pattern such that subclinical but elevated P factor associates with increased fertility, while clinical P factor is associated with lower fertility. There is also some effect of the specific aspect of mental illness, e.g. autism seems particularly bad.
But looking at diagnoses is suboptimal. That is because selection for a trait is about the entire distribution, not some cut-off of the right tail which we label as mentally ill. The use of sibling controls is useful, but also controls for other family factors we might not want to control for and does not provide us with the fertility distribution. There is a solution to this. Mental illness is really a normal-ish distribution trait just like other psychological traits (Plomin’s Abnormal is normal slogan), which is now a days labelled the general factor of psychopathology (P factor). This prior post has a summary. So what we would like is a study relating overall P factor to fertility allowing for nonlinear effects. I am not familiar with a such study, but we can obtain this using the Vietnam Experience Study dataset. It is not optimal as the men are not done breeding at age 38, but it’s the best I can think of. It looks like this:

The blue line is the LOESS (nonlinear fit) and the yellow is the OLS (linear fit). The correlation is tiny but negative as expected. The p value is .015, so not so convincing. If we run a model to control for age and race, the slope drops to p > .10, so basically shrug. VES does not support a negative relationship between overall mental illness and fertility, at least insofar as men aged about 38 tested in 1985 using the MMPI2 are concerned. So where does this leave us? Well, the Swedish data are basically better, except they didn’t use a proper continuous measure of mental illness. So I am going to put this proposal in the “maybe, but important to find out” category.
Income, education, wealth
These may seem trivial, but these typical social status measures show the same negative fertility relationships as does intelligence itself. So they should decline along with intelligence, and yet they keep going up. I don’t even need to show the plots, everybody knows this. For education we could maybe invoke measurement issues over time, since literally degrees are not what they used to be. However, for income and wealth, we are easily able to adjust for inflation (measurement issue) and this does not remove the finding.
Leftwingness/socialism
For a couple of decades, left-wingers have been markedly outbred by religious conservatives. One study (Political Attitude and Fertility: Is There a Selection for the Political Extreme?, 2018) produced these results:

(Yes, it’s ugly.) WVS is the World Values Survey, so it’s a huge, international dataset that spans a couple of decades already. They have a question asking people to place themselves politically, and also ask about fertility. The conservative advantage is stronger in recent decades but can be seen at least since the 1980s.
This has lead some people to predict that the future is religious-conservative in due time: Shall the Religious Inherit the Earth? (Eric Kaufmann 2010). Since the pattern emerged, however, western society has become quite steadily more socialist. I probably don’t need to belabor this point to my readers given the last half-decade of Woke terrorism/race riots, firings, and so on. I don’t think one can quibble that much about the definition of conservative across the waves, which basically means being in favor of things were better in the past in some ways in some vague sense, monogamy, law and order, traditional gender roles and so on. One cannot quibble at all about fertility’s measurement, but one can correctly point out that selection hasn’t been strongly pro-conservative for that long, at least according to these survey data. Those born in the 1980s are those who are currently politically active now, so they should be more conservative than usual, but they are the opposite.
For more takes on why things are getting less conservative, see Richard Hanania’s excellent post.
Non-heterosexuality
This one has been a long-running conundrum for evolutionary psychologists. If sexual preferences are heritable — which they are, e.g. male homosexuality ~35% based on “3,826 studied monozygotic and dizygotic same-sex twin pairs” from Sweden — and fertility of non-heterosexuals, especially homosexuals, is markedly lower, then why do we keep having them around? In fact, homosexuality, and non-heterosexuality in general, seems to generally increase over time, even rapidly in recent Woke years. So how does this make any sense? One can find academic debate on this going back a while. But, first, let’s verify there is really a lower fertility for non-heterosexuals. It was surprisingly difficult to find a study with this basic result, almost all papers are investigating stuff like fertility of siblings or parents of gays to test evolutionary models (or this bizarre paper). So I opened up our trusty GSS:

These results are limited to women aged >=40, and men >=45. OK, so age-confounding is not a major concern. We see a quite marked reduction in fertility. Looks like about 0.3 children for gays, 0.7 for lesbians, compared with 2.5 for heterosexuals in these years. Makes you wonder to which degree fertility decline can be attributed to increased prevalence of non-heterosexuals, but it’s probably not a lot since these are still rare.
Moving on, let’s see some data on prevalence of homosexuality over time. Gallup has the data most people are talking about:
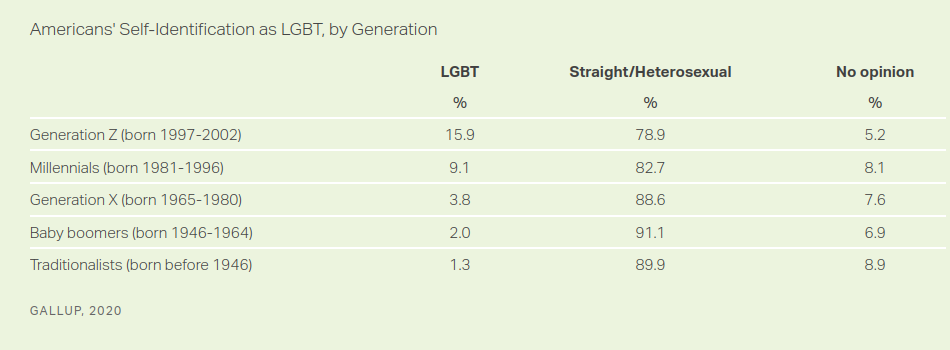
So it’s definitely a mystery! Unlike with intelligence and social status, genetic selection against non-heterosexuality is very strong, and yet it increases. OK, people are probably somewhat more inclined to label themselves non-heterosexual these days, but I don’t think we can doubt that homosexual sex rates have increased markedly.
Criminality/aggression/testosterone
It’s difficult to find studies with measures of testosterone itself and fertility (but for masculinity, we have a lot of data showing a positive correlation) and that matter is somewhat complicated and medical, but we have a lot of data on criminality and testosterone, so for this post I am going to just combine these three concepts: criminality, aggression, testosterone. For the link of aggression and testosterone, there’s a lot of work such as this meta-analysis. For criminality and fertility, we have studies like this one (Criminal offending as part of an alternative reproductive strategy: investigating evolutionary hypotheses using Swedish total population data, 2014):
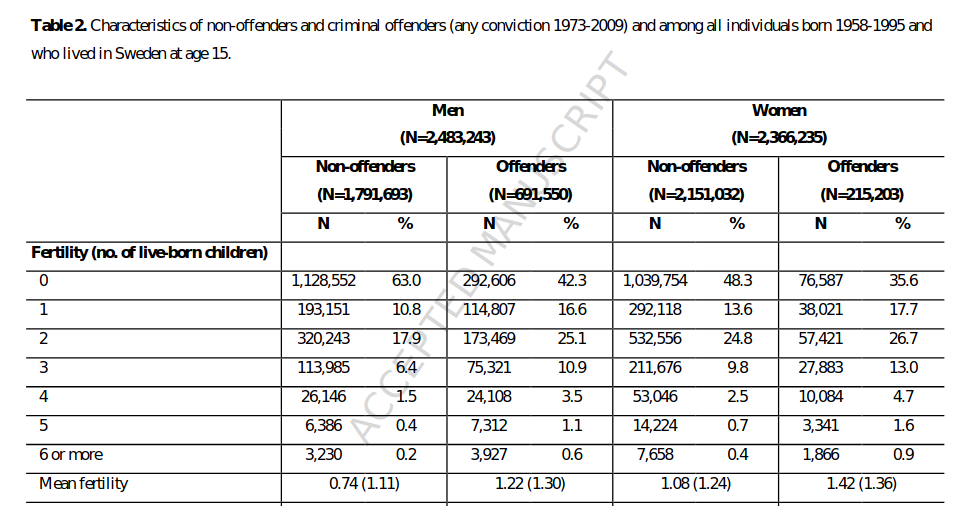
They report a bunch of more fancy results with controls for lots of stuff, and it doesn’t go away but the results are hard to parse since they are now based on Poisson regression. The fertility values are smaller than expected (Swedish fertility is about 1.70) because this is a cross-section that includes a lot of younger people who aren’t done breeding yet. They also show that criminals have more siblings, so the pattern is there in the parents too, even if these were not convicted of anything. ‘Subclinical’ (subconviction) criminality predicts fertility.
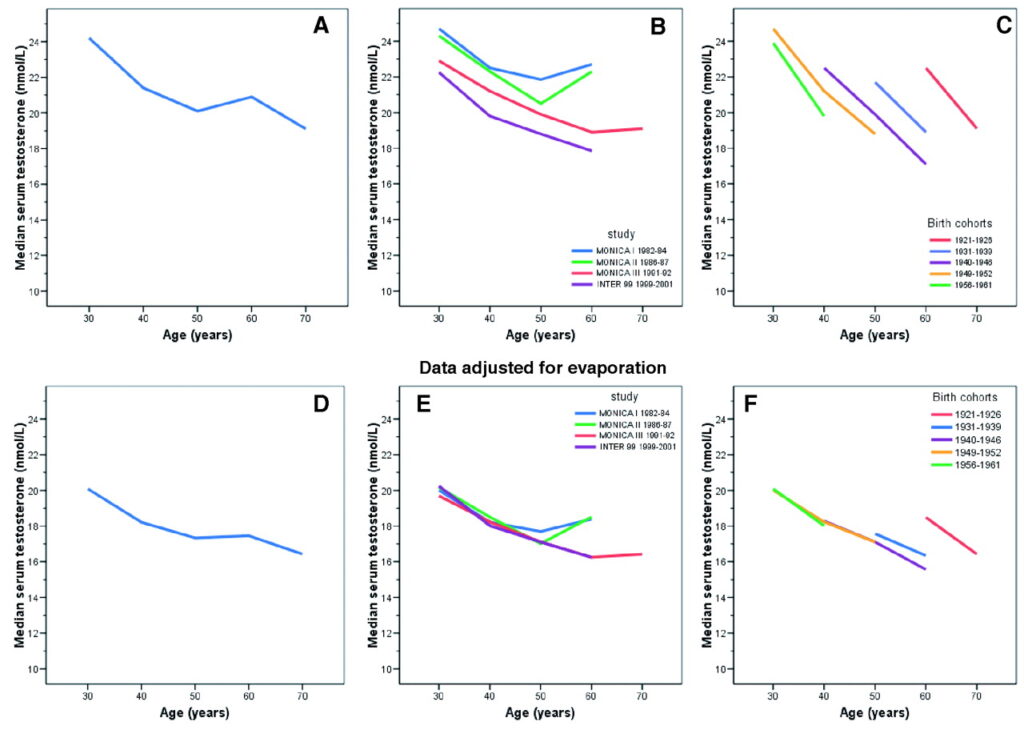
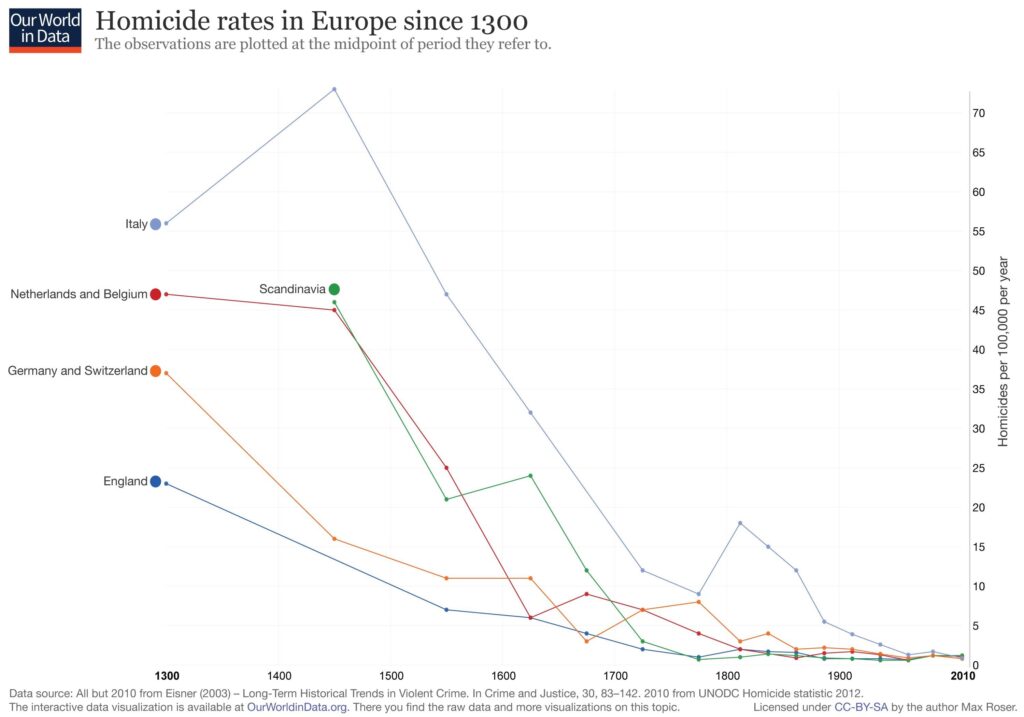
Finally, we need to look at the decline in violence and aggression over time. Steven Pinker wrote a book about this, so let’s look at some typical data:
These are the long-term trends, but what about the recent trends? We can’t really see results since 1900 on that plot, but here’s some for Scandinavia:

There’s no apparent decline since 1950s! Maybe this is due to immigration, however, as Japan does steadily decline and has no immigration. Here’s some data from all crimes in the Netherlands, split by immigration status:
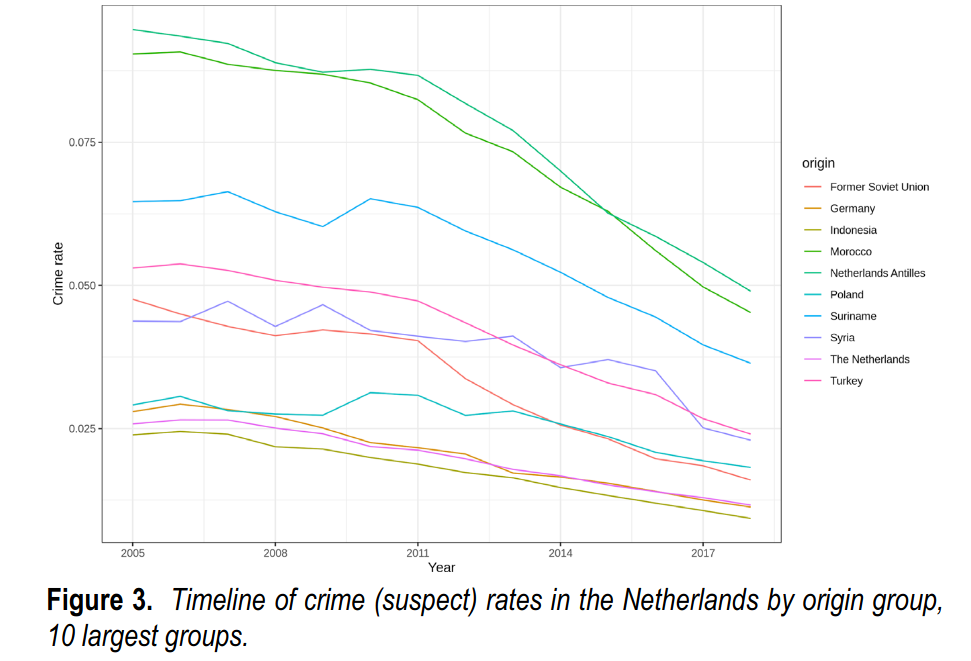
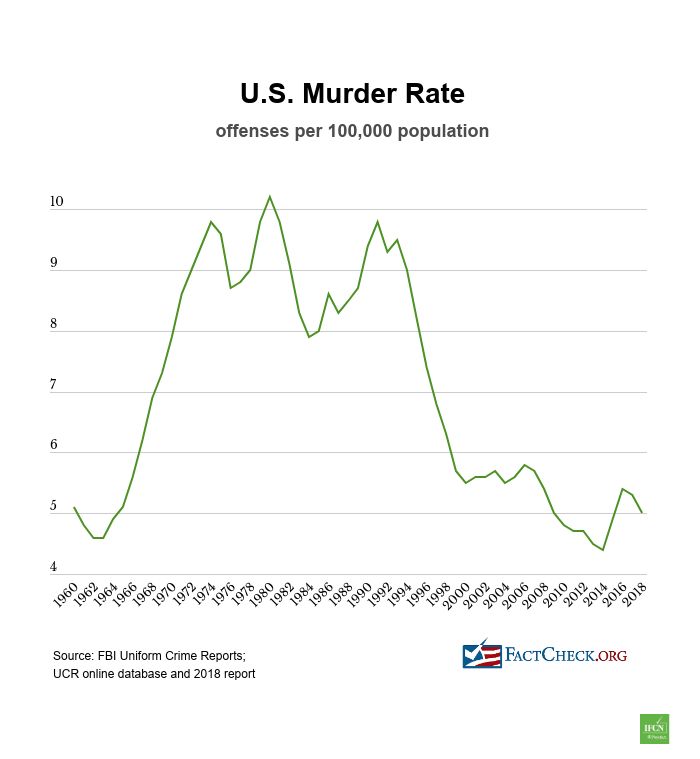
So when we look at all crimes, we see a decline, and it’s apparent for every group in the dataset in the period 2005-2018. What about US trends? Here’s the murder rate:
Violent crime more generally:
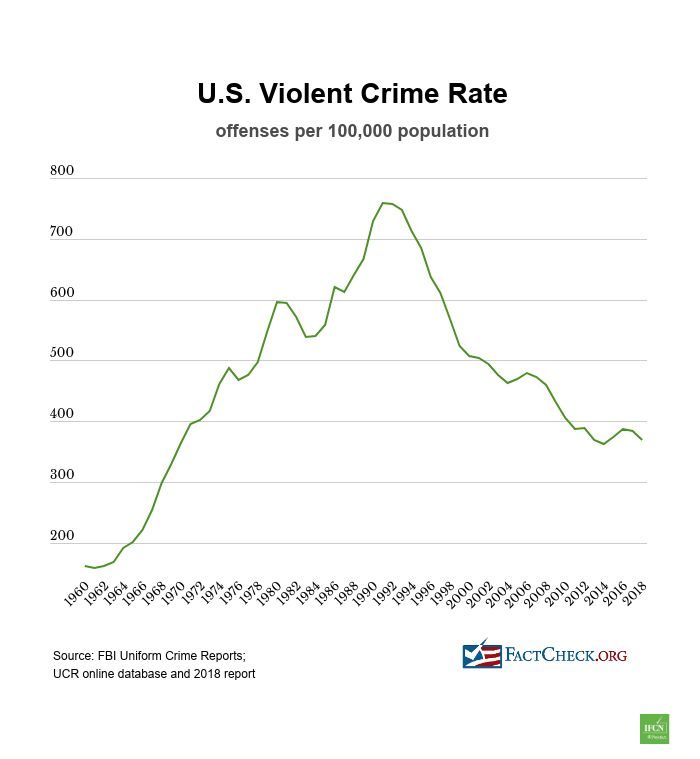
The one for property crime shows the same pattern. The last few years of BLM has seen a surge in crime as well.
The fertility data says that criminality generally should be going upwards. What we find is that crime rates fluctuate wildly, but have a steady long-term decline going back 100s of years. Going back to the testosterone decline, we see associated declines in male fertility measures such as sperm counts, and oppositely, testicular cancer. It seems that basically men are breaking down, unable to act manly, keep women in place etc.
Overall, though there are issues with the testosterone data, generally speaking, criminality/aggression/testosterone is associated with higher fertility. However, instead of getting steadily more crime, aggression and testosterone, we seem to get a lot less testosterone, less aggression, and less crime, though with substantial swings (e.g. 90s crime wave in USA).
Genetic evidence across many traits
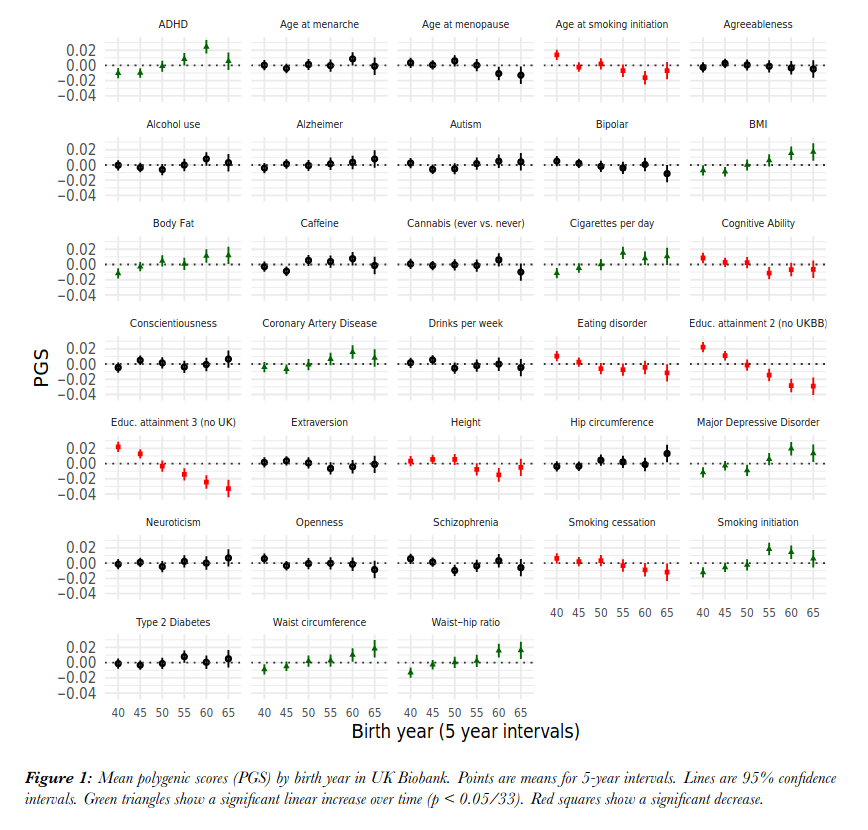
Finally, there is a way to look at a bunch of traits’ secular changes at once if we are tilling to trust polygenic scores for them. The UK Biobank provides a wealth of data for this purpose. This study plotted the trend across many traits:
As I summarized in a prior post looking at dysgenic trends more broadly:
Notice the color coding. Of the 4 things decreasing: age of smoking initiation (start earlier), intelligence (“cognitive ability”), eating disorder (i.e., abnormally thin), educational attainment (one with and without using GWAS results from this sample), height, and smoking stopping. Of the things increasing: ADHD, body fat%, cigarettes per day, coronary artery disease, waist circumference, and waist-hip ratio. So you get the picture: we are genetically breeding for people with poor attention control, lower education and intelligence, who are fatter, shorter and just in general unhealthy.
So these represent the fertility pattern, as evidenced in the genetic scores by current models. To find a paradox, we need to look for a trait where the phenotypic trait is opposite that of the genetic trend. The best case here is height, where there is a well known secular increase. We can confirm this trend in other British data:

This contrasts with the Dutch data showing selection for increased height! Still, we know the phenotype is increasing but selection is against it as evidenced by survey data and genetic data, so this is a confirmed paradox.
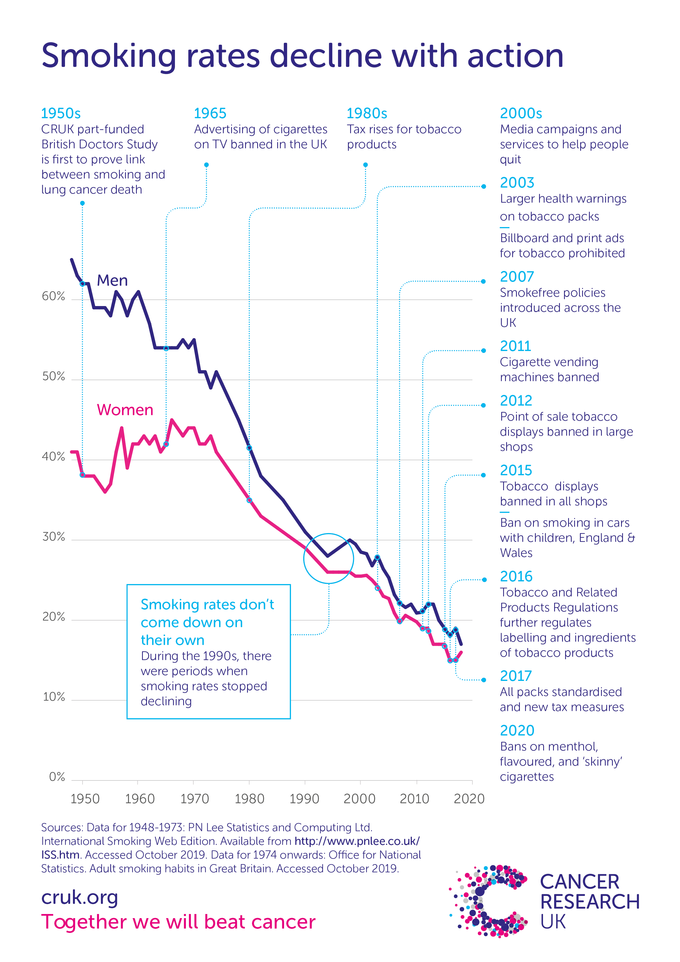
Smoking status (cigarettes per day) presents another paradox, as smoking prevalence has been decreasing for many decades:
There is no paradox with the weight/obesity associated variables (BMI, body fat, waist), since the phenotype is also increasing (obesity is going strong). Finally, we see some scant evidence of the increase in mental illness due to selection, at least, for depression. It is however reversed for for eating disorder, and we don’t see anything for schizophrenia, bipolar, neuroticism, or autism. ADHD is increasing, but so is the prevalence, so there’s no paradox.
Conclusions
Overall, we find:
- There is solid evidence for selection paradoxes for several phenotypes, including height (UK), education/income/wealth, IQ scores (but maybe not intelligence itself), smoking, socialism, and non-heterosexuality
- There is some evidence for paradoxes with mental illness, and violence/aggression/criminality
It is probable that some of these trends have common causes. Criminality is associated with socialist politics, non-heterosexuality is associated with socialist politics (so much that Wikipedia deems it necessary to have articles like Liberal homophobia and LGBT conservatism), socialist politics is associated with mental illness. But the others are not so clustered.