In popular discourse and the media, the debate is between those who recognize significant genetic causation in mental illnesses versus the status quo blank slate people who leave all such talk out and talk only about deprivation, stigma, and discrimination. In research, however, things are considerably more complicated. Among researchers, pretty much everybody accepts large genetic causation. Rather, that is my guess since I don’t actually know of any surveys of, say, psychiatrists on this question (let me know if you find any!). That being the case, a new important study was published a few days ago, and it’s worth going over:
- Grotzinger, A. D., Mallard, T. T., Akingbuwa, W. A., Ip, H. F., Adams, M. J., Lewis, C. M., … & Nivard, M. G. (2022). Genetic architecture of 11 major psychiatric disorders at biobehavioral, functional genomic and molecular genetic levels of analysis. Nature Genetics, 1-12.
We interrogate the joint genetic architecture of 11 major psychiatric disorders at biobehavioral, functional genomic and molecular genetic levels of analysis. We identify four broad factors (neurodevelopmental, compulsive, psychotic and internalizing) that underlie genetic correlations among the disorders and test whether these factors adequately explain their genetic correlations with biobehavioral traits. We introduce stratified genomic structural equation modeling, which we use to identify gene sets that disproportionately contribute to genetic risk sharing. This includes protein-truncating variant-intolerant genes expressed in excitatory and GABAergic brain cells that are enriched for genetic overlap across disorders with psychotic features. Multivariate association analyses detect 152 (20 new) independent loci that act on the individual factors and identify nine loci that act heterogeneously across disorders within a factor. Despite moderate-to-high genetic correlations across all 11 disorders, we find little utility of a single dimension of genetic risk across psychiatric disorders either at the level of biobehavioral correlates or at the level of individual variants.
Ok, it is not exactly new. As a matter of fact, despite being ‘published’ on the 6th May, it has 30 citations (as of writing), so these were referring to the preprint form which is old, like 2020 old.
The short story of the paper is that they compiled previous association studies (GWASs) for 11 diagnoses. Then they carried out analyses of the results of these. This has multiple goals. The main is trying to understand the causes in more depth, which can help with the thorny questions involving how to classify the various issues people can have. Studies like this one assume the standard framework of familiar labels, as this is how they got their data. One interesting thing to start with, then, is the genetic correlations between the various labels:
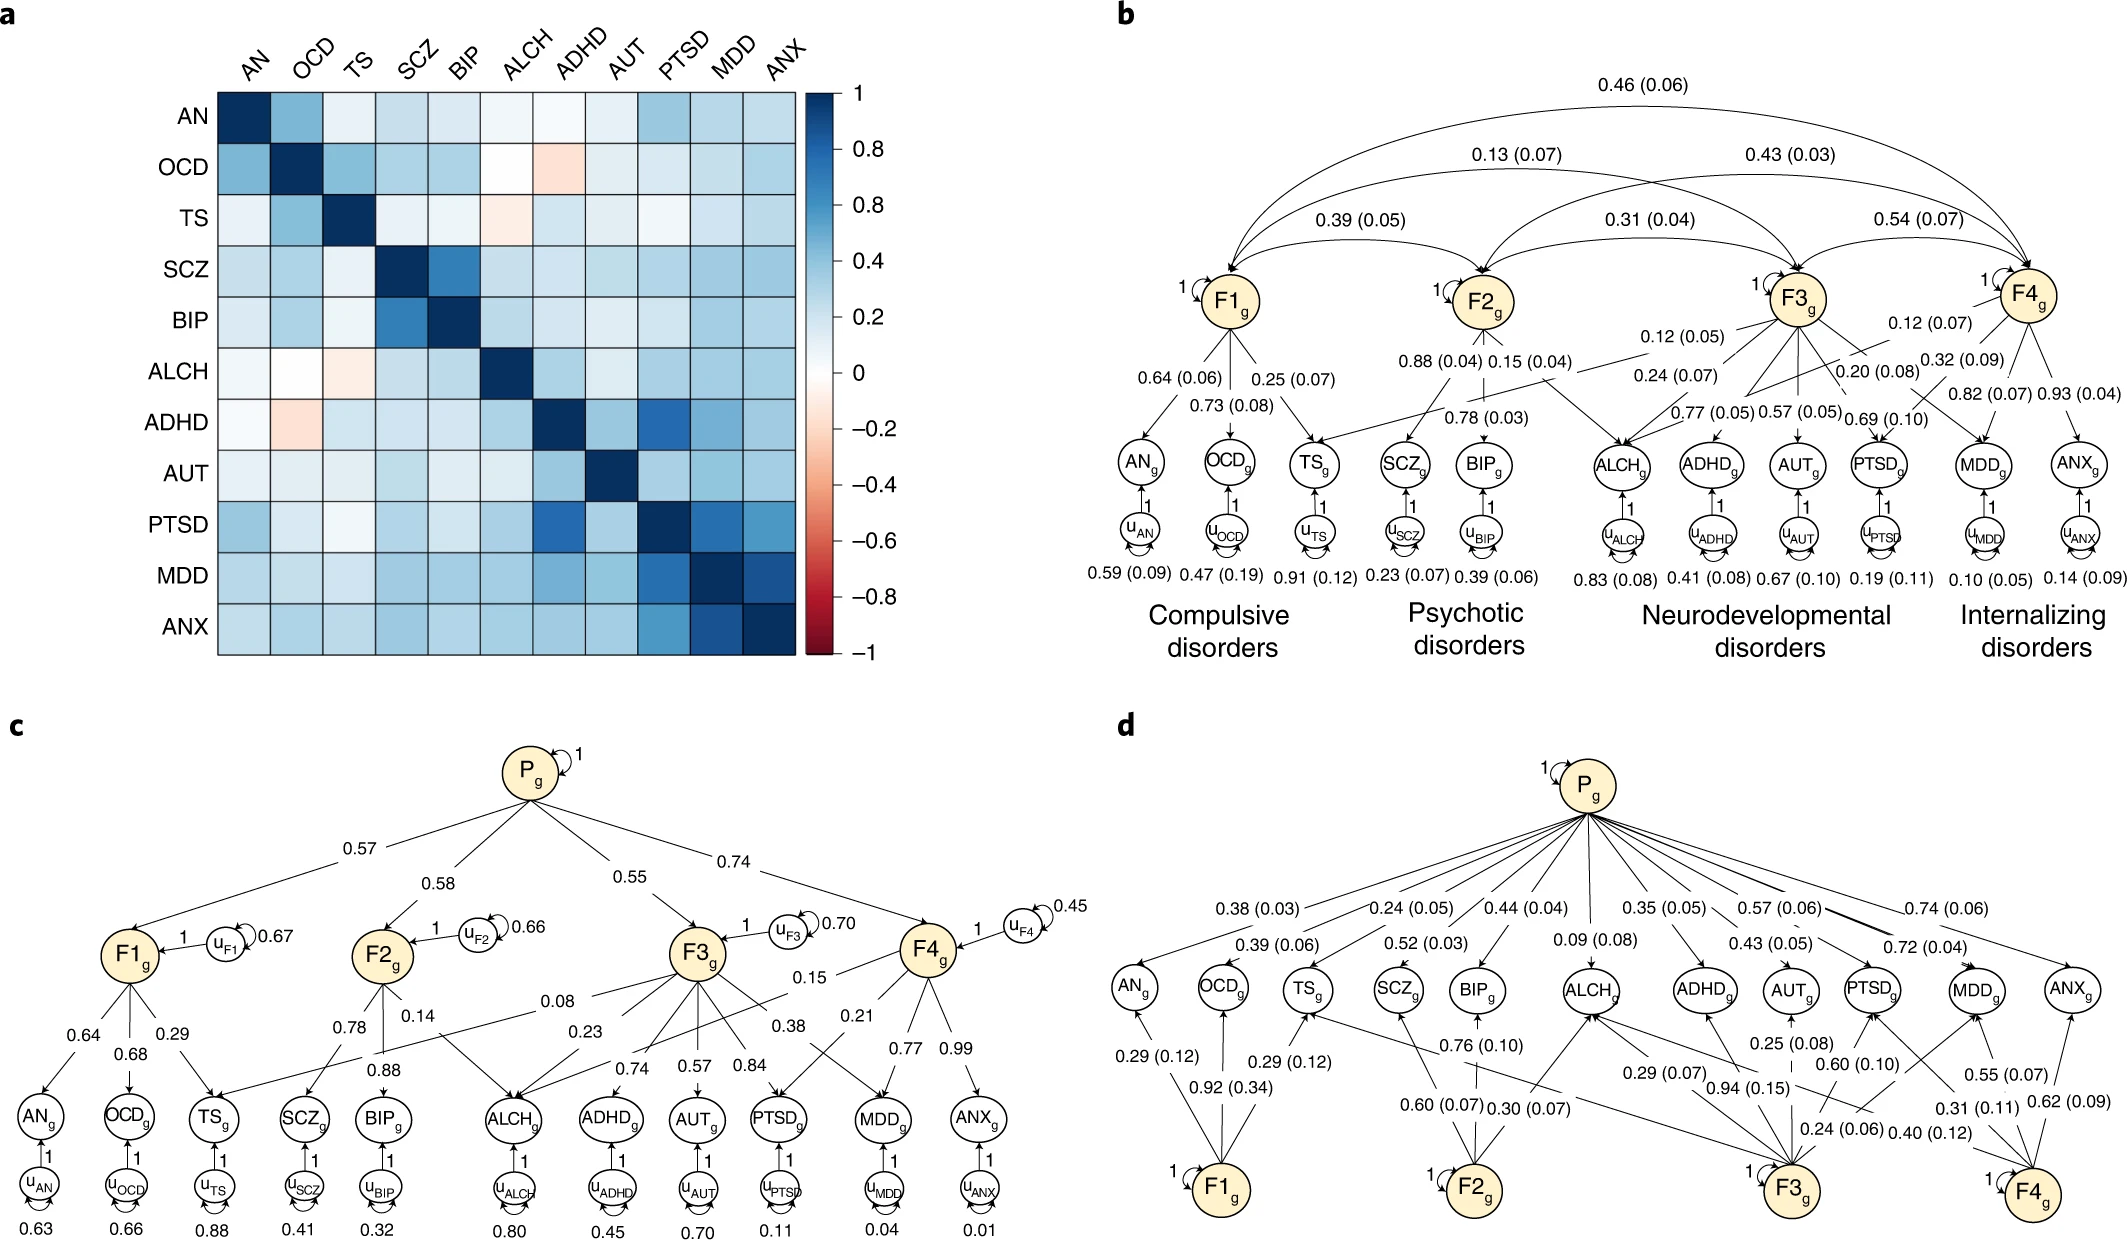
a, Genetic correlations estimated using LDSC. b, Standardized results for the correlated factors. c, Standardized results from the hierarchical factor model. d, Standardized results from the bifactor model. The genetic components of disorders and common genetic factors of disorders are inferred variables that are represented as circles. Regression relationships between variables are depicted as one-headed arrows pointing from the independent variables to the dependent variables. Covariance relationships between variables are represented as two-headed arrows linking the variables. (Residual) variances of a variable are represented as a two-headed arrow connecting the variable to itself; for simplicity, residuals of the indicators are not depicted for the bifactor model. The g subscript is used throughout the path diagrams to denote that the variables in these models are strictly defined by the genetic variance captured by current GWAS estimates. ADHD, attention-deficit/hyperactivity disorder; OCD, obsessive-compulsive disorder; TS, Tourette syndrome; PTSD, post-traumatic stress disorder; AN, anorexia nervosa; AUT, autism spectrum disorder; ALCH, problematic alcohol use; ANX, anxiety; MDD, major depressive disorder; BIP, bipolar disorder; SCZ, schizophrenia; F, factor.
So in this study, they have 11 such labels/diagnoses/classes. The top left figure shows the genetic correlations between them, which one can take as an estimate of the degree to which they share genetic causes (and some cross-trait assortative mating). As one can see, most cells (pairwise combinations) are blue, meaning they are positive values. This is just telling you what you already know: if you have one diagnosis, you chance of having another one, or getting one eventually, is higher than average. But there’s a few pairs that are not blue. Most conspicuously the ADHD and OCD pairs. We can think of ADHD as a kind of failure to concentrate, focus on goals one has, inability to plan properly, and having high time preference in economist terms. OCD is being too concerned with planning, organizing, being tidy, and especially cleaning. So in OCEAN personality terms, ADHD involves having too low conscientiousness and OCD involves having too high conscientiousness. This is one of those examples of personality dimensions not being monotonic in terms of utility, rather one needs to have some optimal middle value. The optimal value is not necessary the average/median (50th centile), for conscientiousness it is generally better to be higher, but probably better to be below the 95th centile.
The other red cell is that between TS and ALCH. My guess for explaining this one is that alcoholics also say outrageous things and this gets them the alcoholism diagnosis, whereas when Tourette people say crazy things and they aren’t even drunk, they get a different label. So I propose a kind of diagnosis bias where Tourette people who also drink too much get classified as alcoholics only, instead of as both, which results in a relative absence of people with both diagnoses. There are some other white cells (no association), such as that between ALCH and OCD, which presumably has a similar explanation to the ADHD-OCD combination. Other pairs are more obvious: people who are anxious (ANX) are also pretty sad and depressive (MDD). Generally, some of these GWASs were kinda small, and may have some bias, so these results should not be taken as more than a current (actually 2020) best guess. Samples sizes: “average total sample size per disorder = 156,771 participants; range = 9,725–802,939”.
The other 3 parts of the figure represent mathematical ways to try to make sense of these genetic correlations. One could kind of cluster them (top right), and that will result in a correlated factors model. In that model, one is telling the computer that though we see 11 disorders, really, there are only 4 major underlying ones, and their potential associations among each other. These broader factors are themselves correlated (hence the arrows between them), which could be due to them being genetically correlated too, or maybe caused by a more general tendency. The latter idea is the general psychopathology factor, called the P factor. One can make a P factor using using correlated factors, in which case one gets the hierarchical model (bottom left), or one can force the first order factors to be orthogonal and add a general factor (one that causes every diagnosis) in which case one gets the bi-factor model (bottom right). Distinguishing between these causal models purely on statistical grounds is hard. This is the same debate one can find in the intelligence literature. I personally like the bi-factor approach, mainly because it is easy to think about as the group factors will be uncorrelated with the general factor (P). That is, each person is assigned a P factor score, a compulsive score (F1), a psychoticism score (F2), a developmental disorder score (F3), and a mood disorder/internalizing score (F4). You can see that if one had included 20 instead of 11 diagnoses to begin with, one would have gotten a more fine-grained and somewhat different picture, and there’s some other studies that have done that. But using the current framework, one could score a given person for these 5 factors: P, F1-F4, and use them to correlate with other variables to look for patterns. The authors didn’t do that, they used the correlated factors model, which will give you about the same 4 group factors F1-F4, and they added the P factor from their hierarchical model. Now I would have liked to use the bi-factor results because the F1-F4 factors would be unrelated to the P factor in these plots, and thus easier to interpret. The F1-F4 factors in their plots are correlated with P, so they are not a pure measure of, say, compulsive tendencies, but is some mix of compulsive tendencies and general mental illness. Even in their 160 pages of supplementary information, they didn’t include a figure based on the bi-factor model, so we have to do with their main figure:
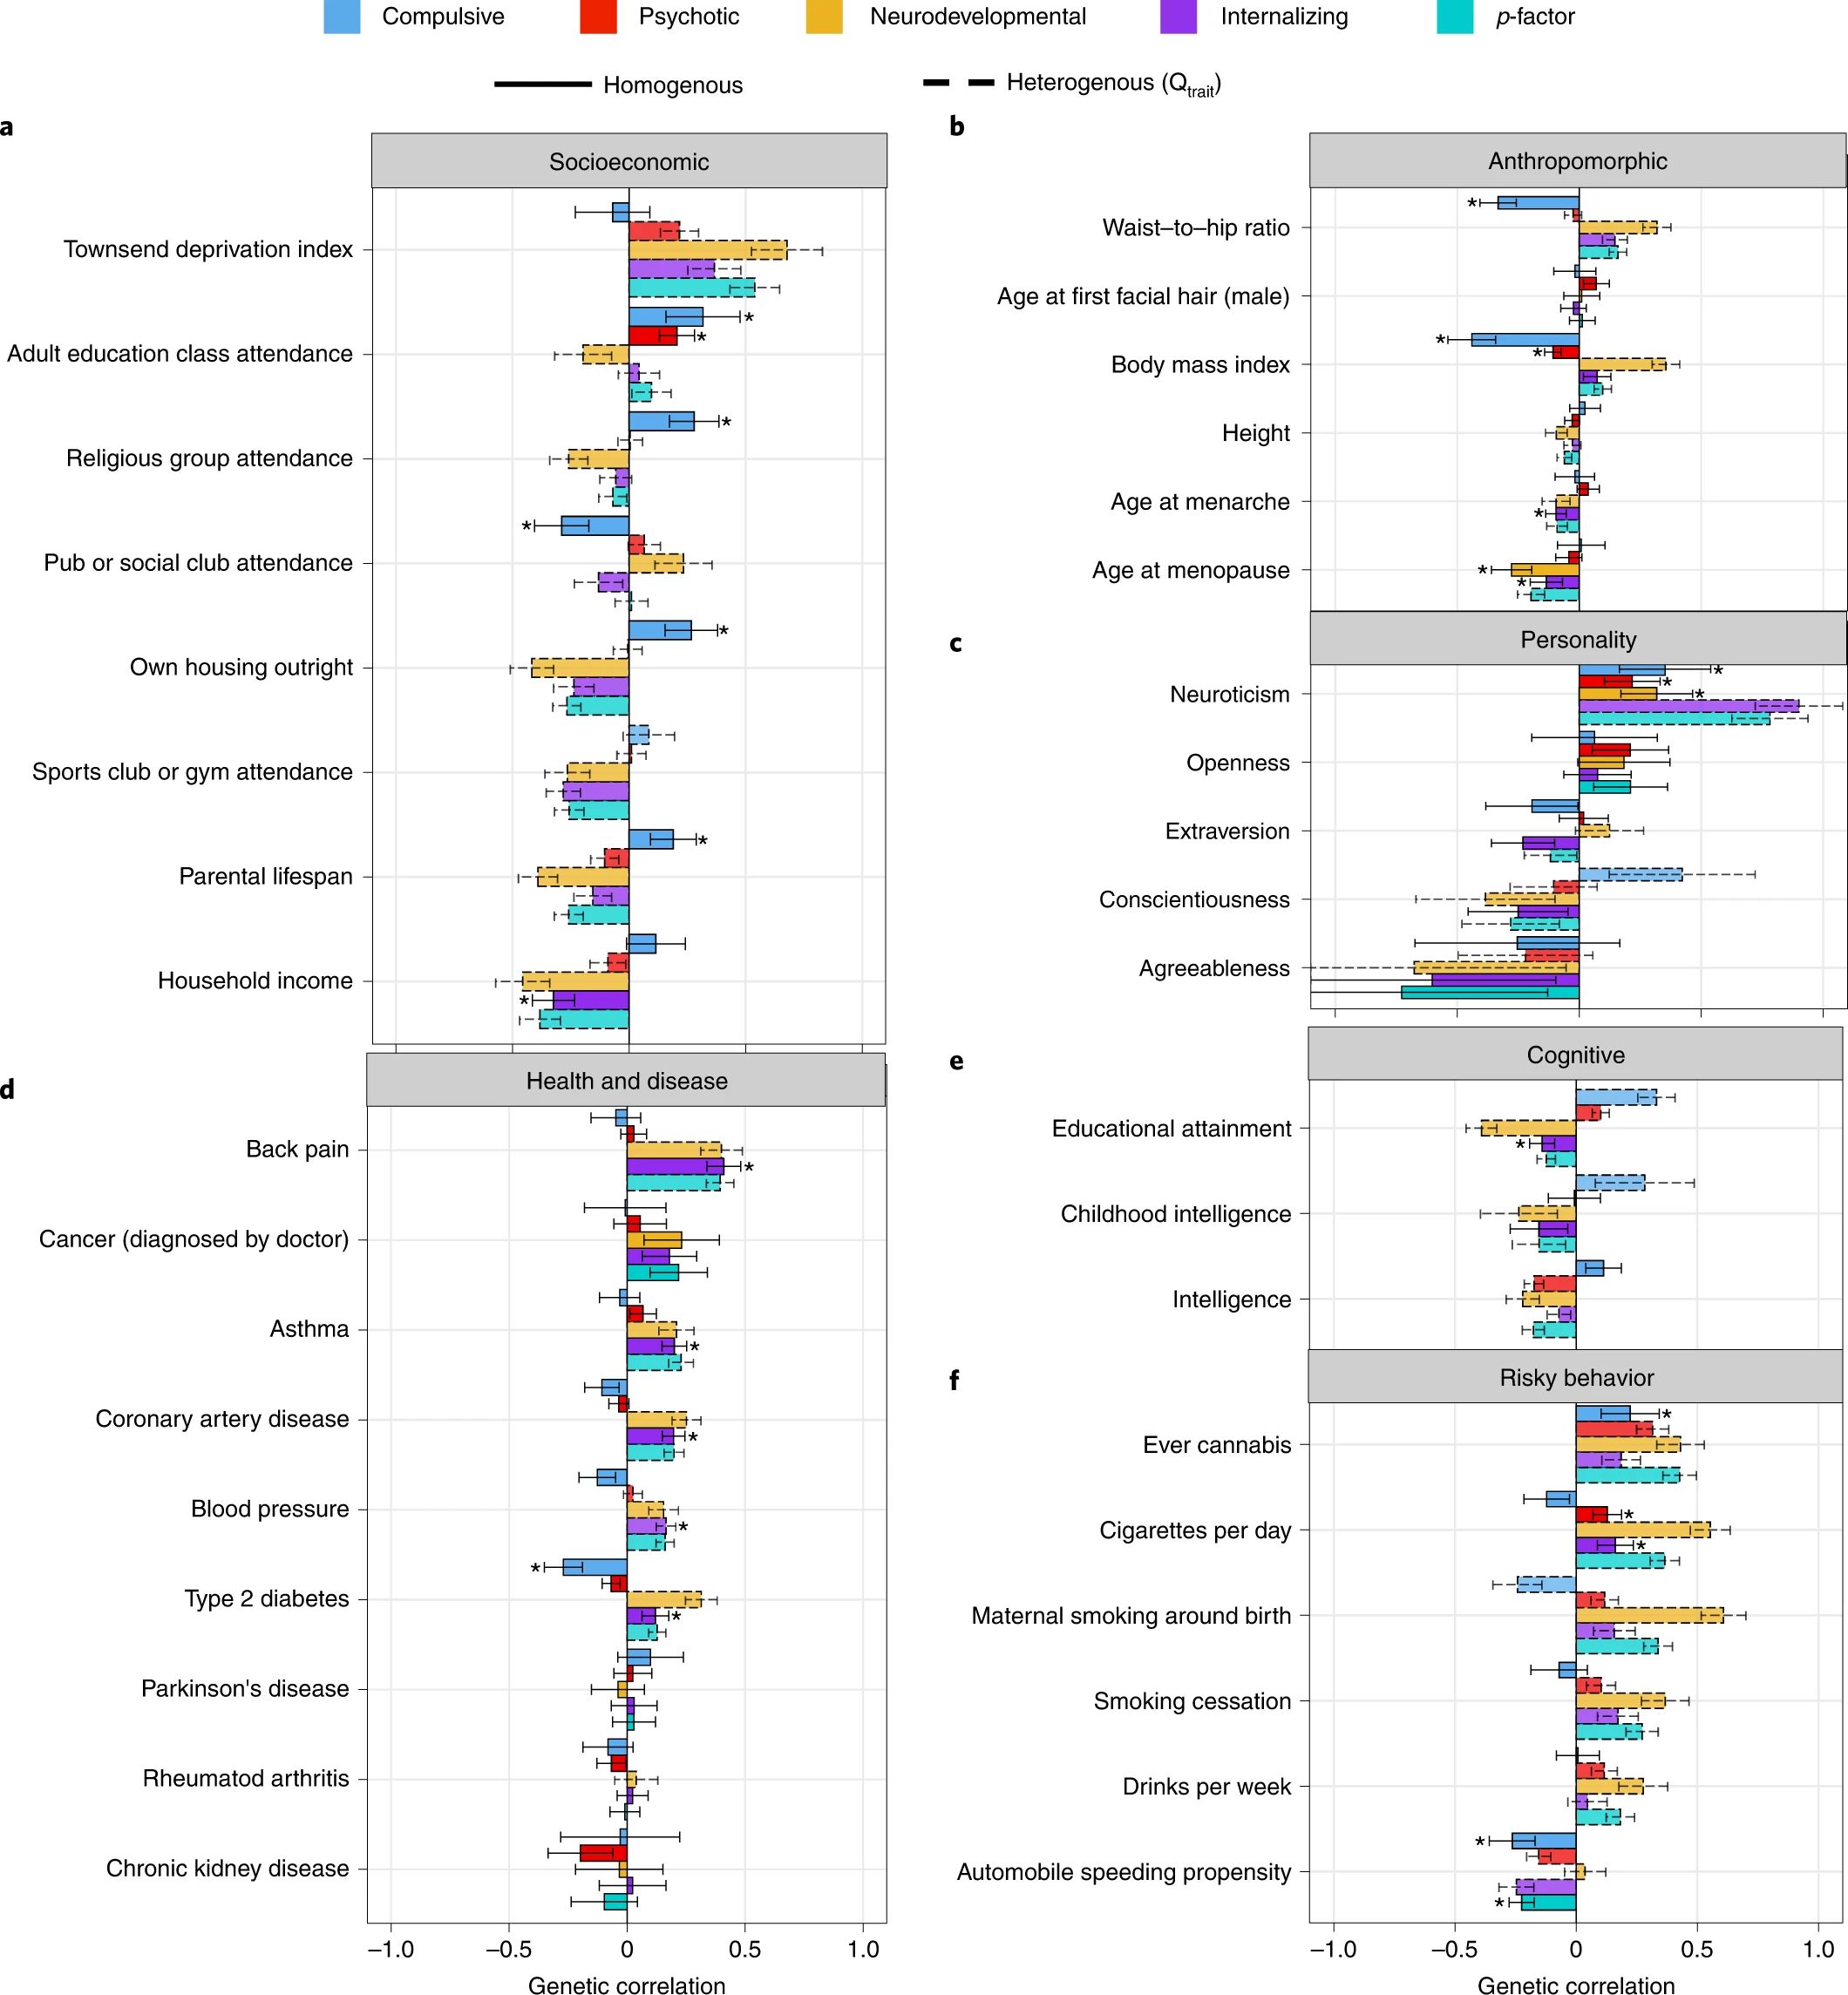
a–f, Point estimates for genetic correlations with complex traits of interest for the four psychiatric factors from the correlated factors model and the second-order p-factor from the hierarchical model. Genetic correlations are shown for socioeconomic (a), anthropomorphic (b), personality (c), health and disease (d), cognitive (e) and risky behavior outcomes (f). Bars with a dashed outline were significant at a Bonferroni-corrected threshold for model comparisons indicating heterogeneity across the factor indicators in their genetic correlations with the outside trait. Error bars are ±1.96 s.e. Bars with an asterisk above produced a genetic correlation that was significant at a Bonferroni-corrected threshold and were not significantly heterogeneous. The total effective sample size for the factors was as follows: compulsive factor (n = 19,108), psychotic factor (n = 87,138), neurodevelopmental factor (n = 55,932), internalizing factor (n = 455,340) and hierarchical p-factor (n = 667,343). Sample sizes for the complex traits are reported in Supplementary Table 5.
The most interesting associations are when we see starkly different associations with some third variable. For instance, we see that the compulsion factor has no association with deprivation index (basically how poor/bad neighborhood you grew up in), while the other factors are also related to living in bad neighborhoods. We see the same kind of pattern looking at parental lifespan, where compulsive has a positive association (presumably due to obsession with health matters) and the others are somewhat negative. As a matter of fact, this compulsion vs. everything else is found often: conscientiousness, intelligence, education, smoking, obesity/BMI, and so on, same pattern. We can also check out the associations with some of these variables for the 11 diagnoses, as they were posted in the supplementary materials:
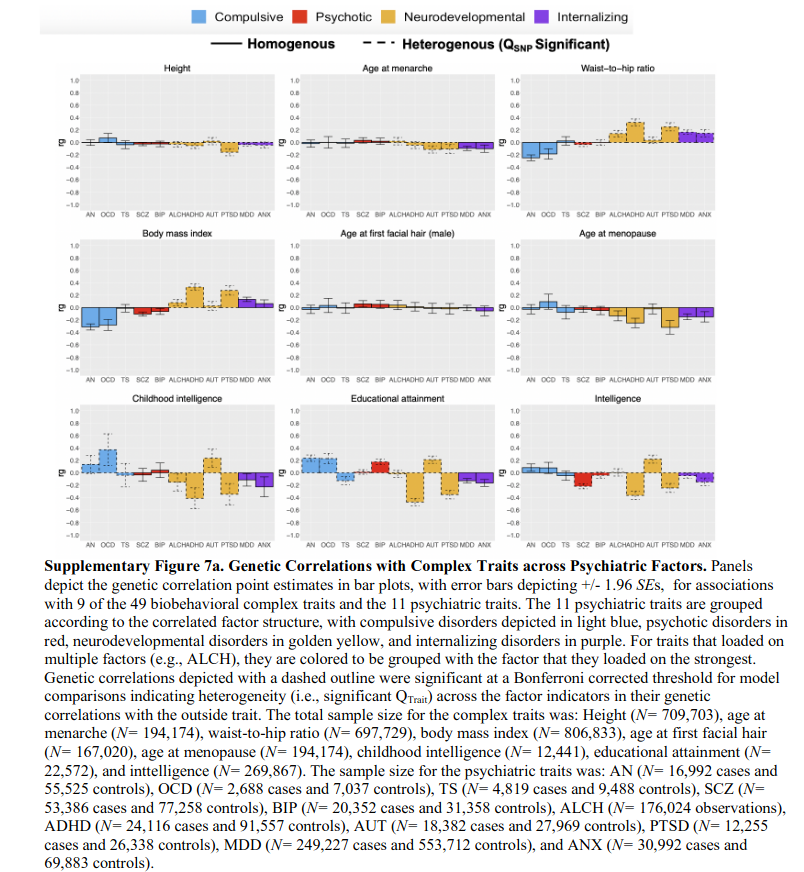
These cover the same kinds of results I discussed in the prior post about intelligence and mental health, e.g. autism shows a slight positive genetic correlation with intelligence.
Which model is best, bi-factor, correlated factors, hierarchical? They use some of those model comparison statistics I mentioned earlier, and they find the correlated factors model is the best fit for their data. That’s why they used it for the plot above. My worry here is that since they had to rely on the premade ICD/DSM-based diagnoses, this will bias the results in various directions. For instance, many disorders often require that one does not satisfy another diagnoses to get it (exclusion rules). This creates artificially negative associations between diagnoses compared to using a simpler, consistent threshold model. This is the same criticism the network psychometrics people have. They say instead one should start with a long list of more basic units, symptoms/behaviors, and then estimate all of their genetic associations (i.e. do a GWAS for each), and then build upwards from scratch. I think the network psychometrics people are generally right about this. So the current discussion of bi-factor vs. hierarchical vs. correlated factors, I don’t think one should worry too much about. And the network psychometrics approaches also produce quite similar scores for people anyway, as it is really mostly a statistically equivalent way of describing data based on different causal assumptions. They don’t talk about a P factor causing things, but they note that some symptoms are more central to the causal network than others, so one can assign them centrality measures, which are nearly the same as P-factor loadings in a typical latent variable model framework.
From a practical perspective, we don’t need to worry about the exact underpinnings. We just need to have useful indexes that we can use for embryo selection, and test our interventions against.

