We published a new paper a few days ago:
- Wright, S., & Kirkegaard, E. O. W. (2023). Intelligence Inequality and Income Inequality: The Missing Link. Comparative Sociology, 22(2), 298–319. https://doi.org/10.1163/15691330-bja10077
This article evaluates the relationship between inequality in cognitive test scores across countries and income inequality. By meta-analyzing the standard deviations in PISA results from 2000 to 2018, the authors construct a measure of intelligence inequalities across countries. They then test this measure to investigate if it has any association with income inequality as measured by the gini index. Across all models and subsamples, the authors do not find a positive association between intelligence inequality and income inequality. In models where the coefficient is statistically significant, the direction is unexpectedly negative, implying greater intelligence inequality is associated with lower income inequality. This is contrary to theoretical predictions of a positive association between these variables. Finally, the authors also find some evidence that greater mean intelligence is associated with lower levels of income inequality.
It’s a point often discussed. Since intelligence is causal for social outcomes of importance in society, having a higher mean of intelligence of person, a population, or a subpopulation means that he/it will also have higher social status, all else equal. This point has been proven repeatedly for individuals, subpopulations (e.g. race groups), countries, and subnational units (states etc.). For research on countries and national intelligence, see my study with George Francis from 2022; for parts of countries, see the meta-analysis from 2018 or this paper from 2022 about regions of Italy.
However, a related point is that if populations have a greater variability of intelligence, they should also be more variable in social status. We see this for men vs. women in society. There’s always more men among the losers (e.g. homeless) and more men among the winners (self-made billionaires are nearly 100% male). The same point should also apply between countries. Richard Lynn’s pioneering work on national intelligence did not aim to gather data for country standard deviations in IQ, and neither did David Becker’s reworking of this. The PISA datasets, however, do have information about the standard deviations of countries, so in theory it should be easy to show that this point holds. Except we find that it doesn’t! Let’s go over the data and speculate on why this prediction fails.
Here’s all the standard deviations from every PISA report. Their correlations look like this:

We get a positive manifold as expected, but some of the correlations are quite weak, especially to math 2000. Still, with so many indicators, the general factor of these will be very reliable. The world map of this variability score looks like this:
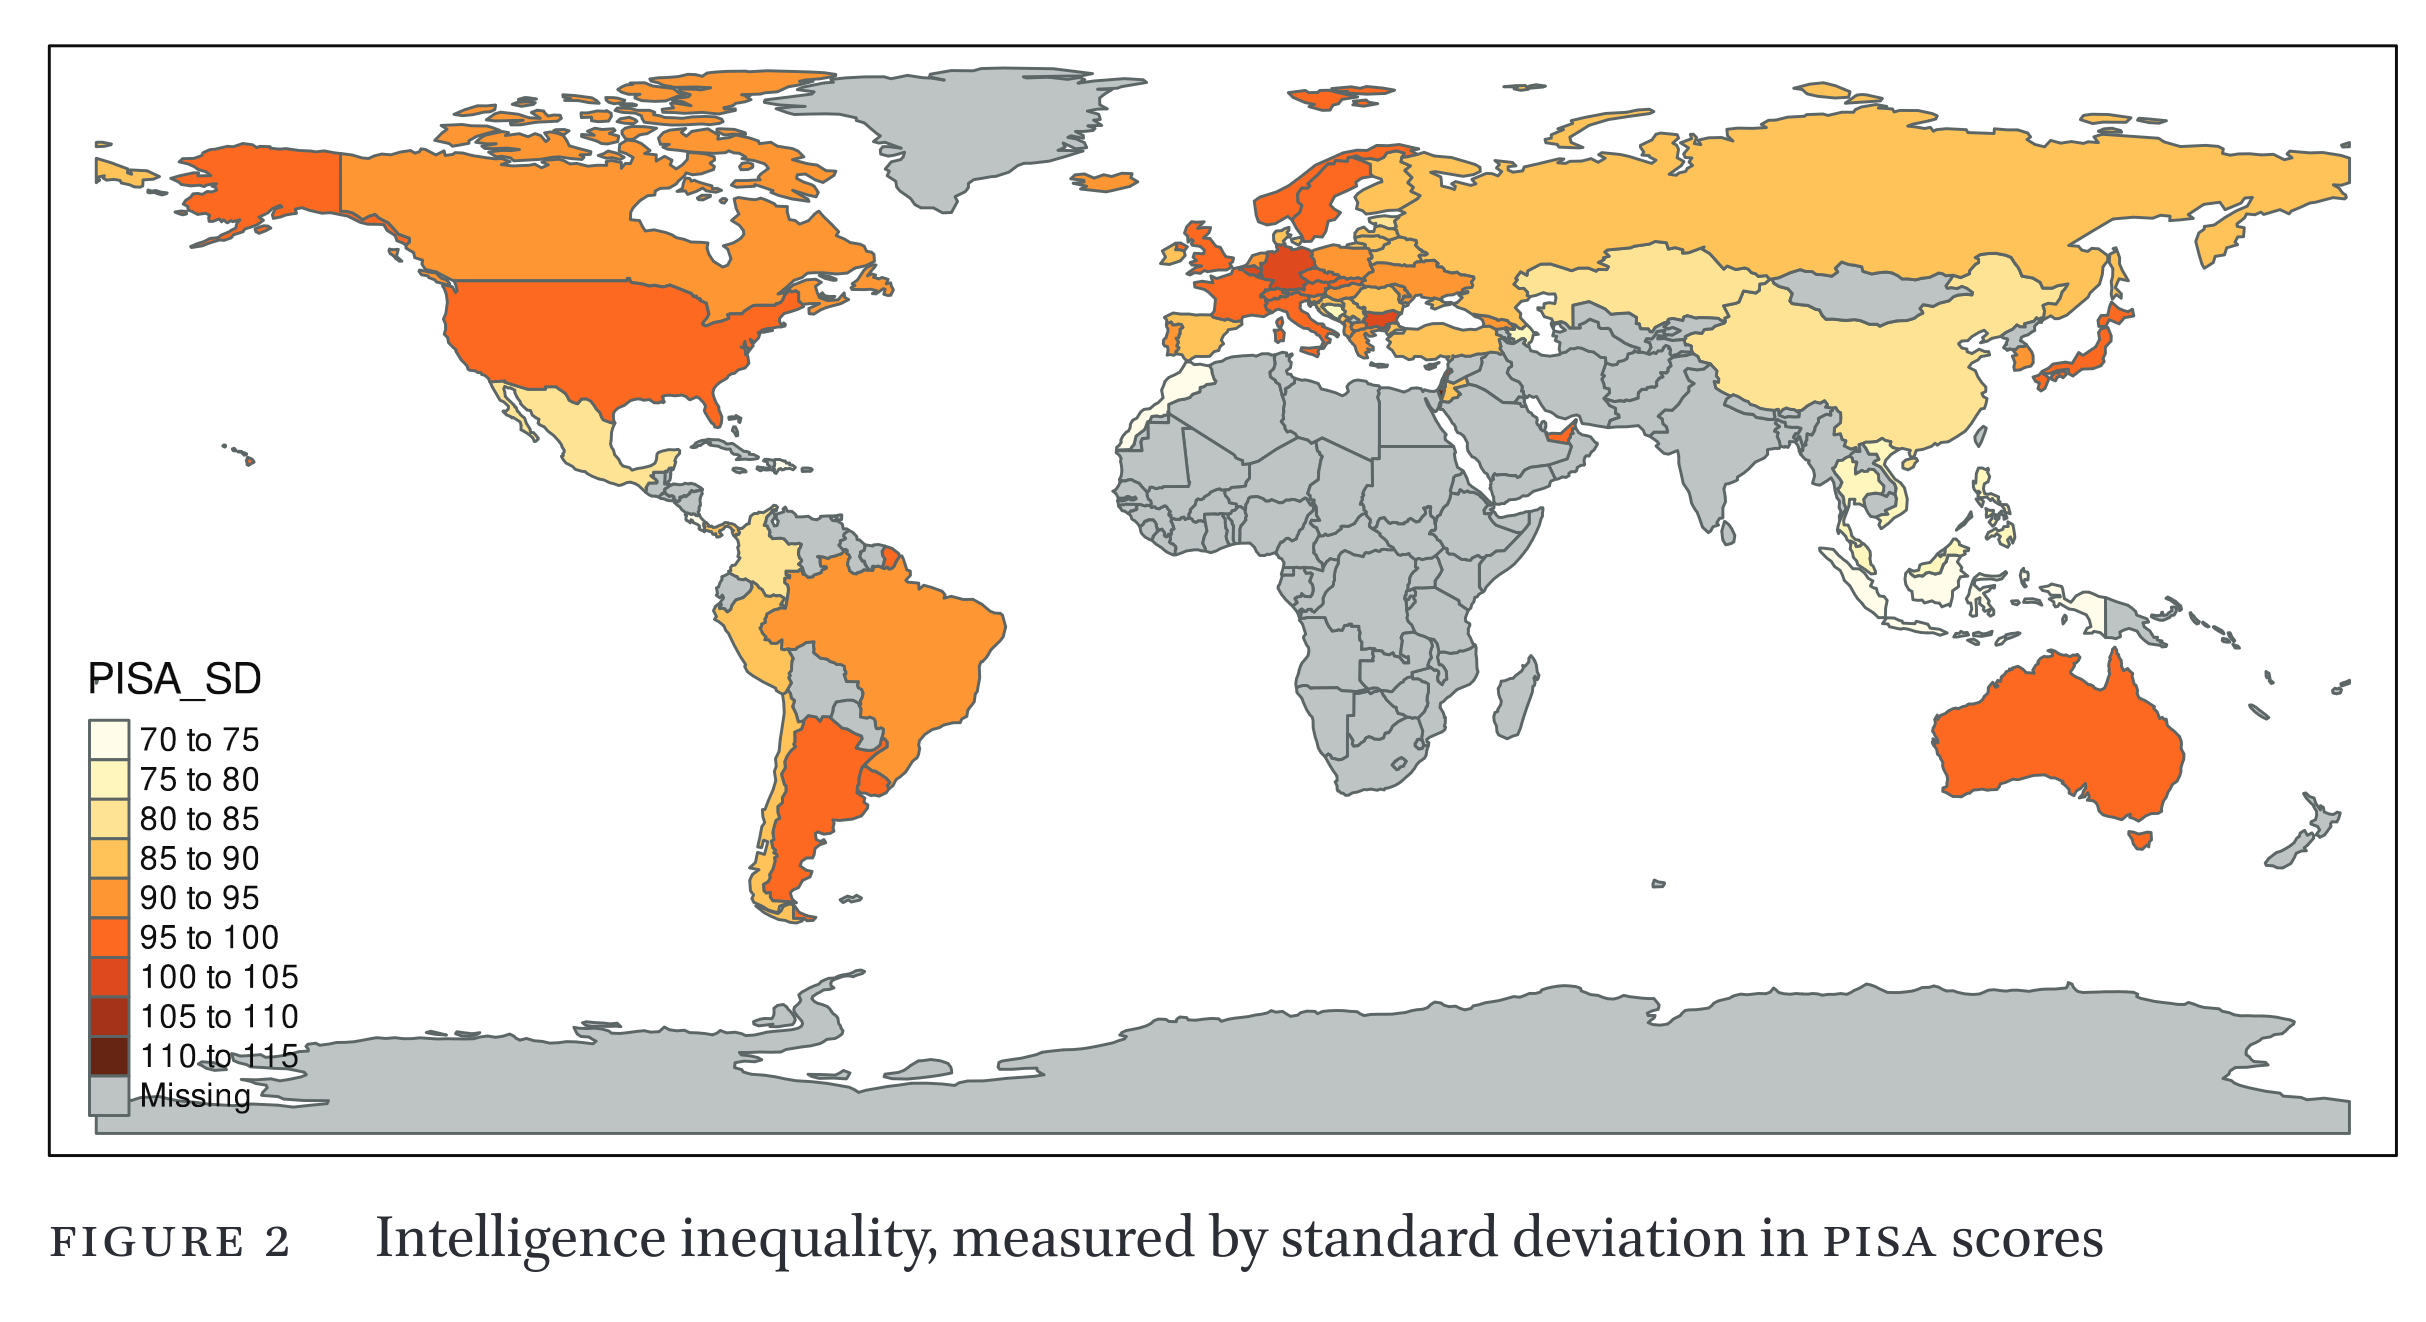
It appears south Asians are low in variability, while Japan is high (??) and some random other countries. It’s not immediately obvious what we are getting at. Correlations with other key variables:
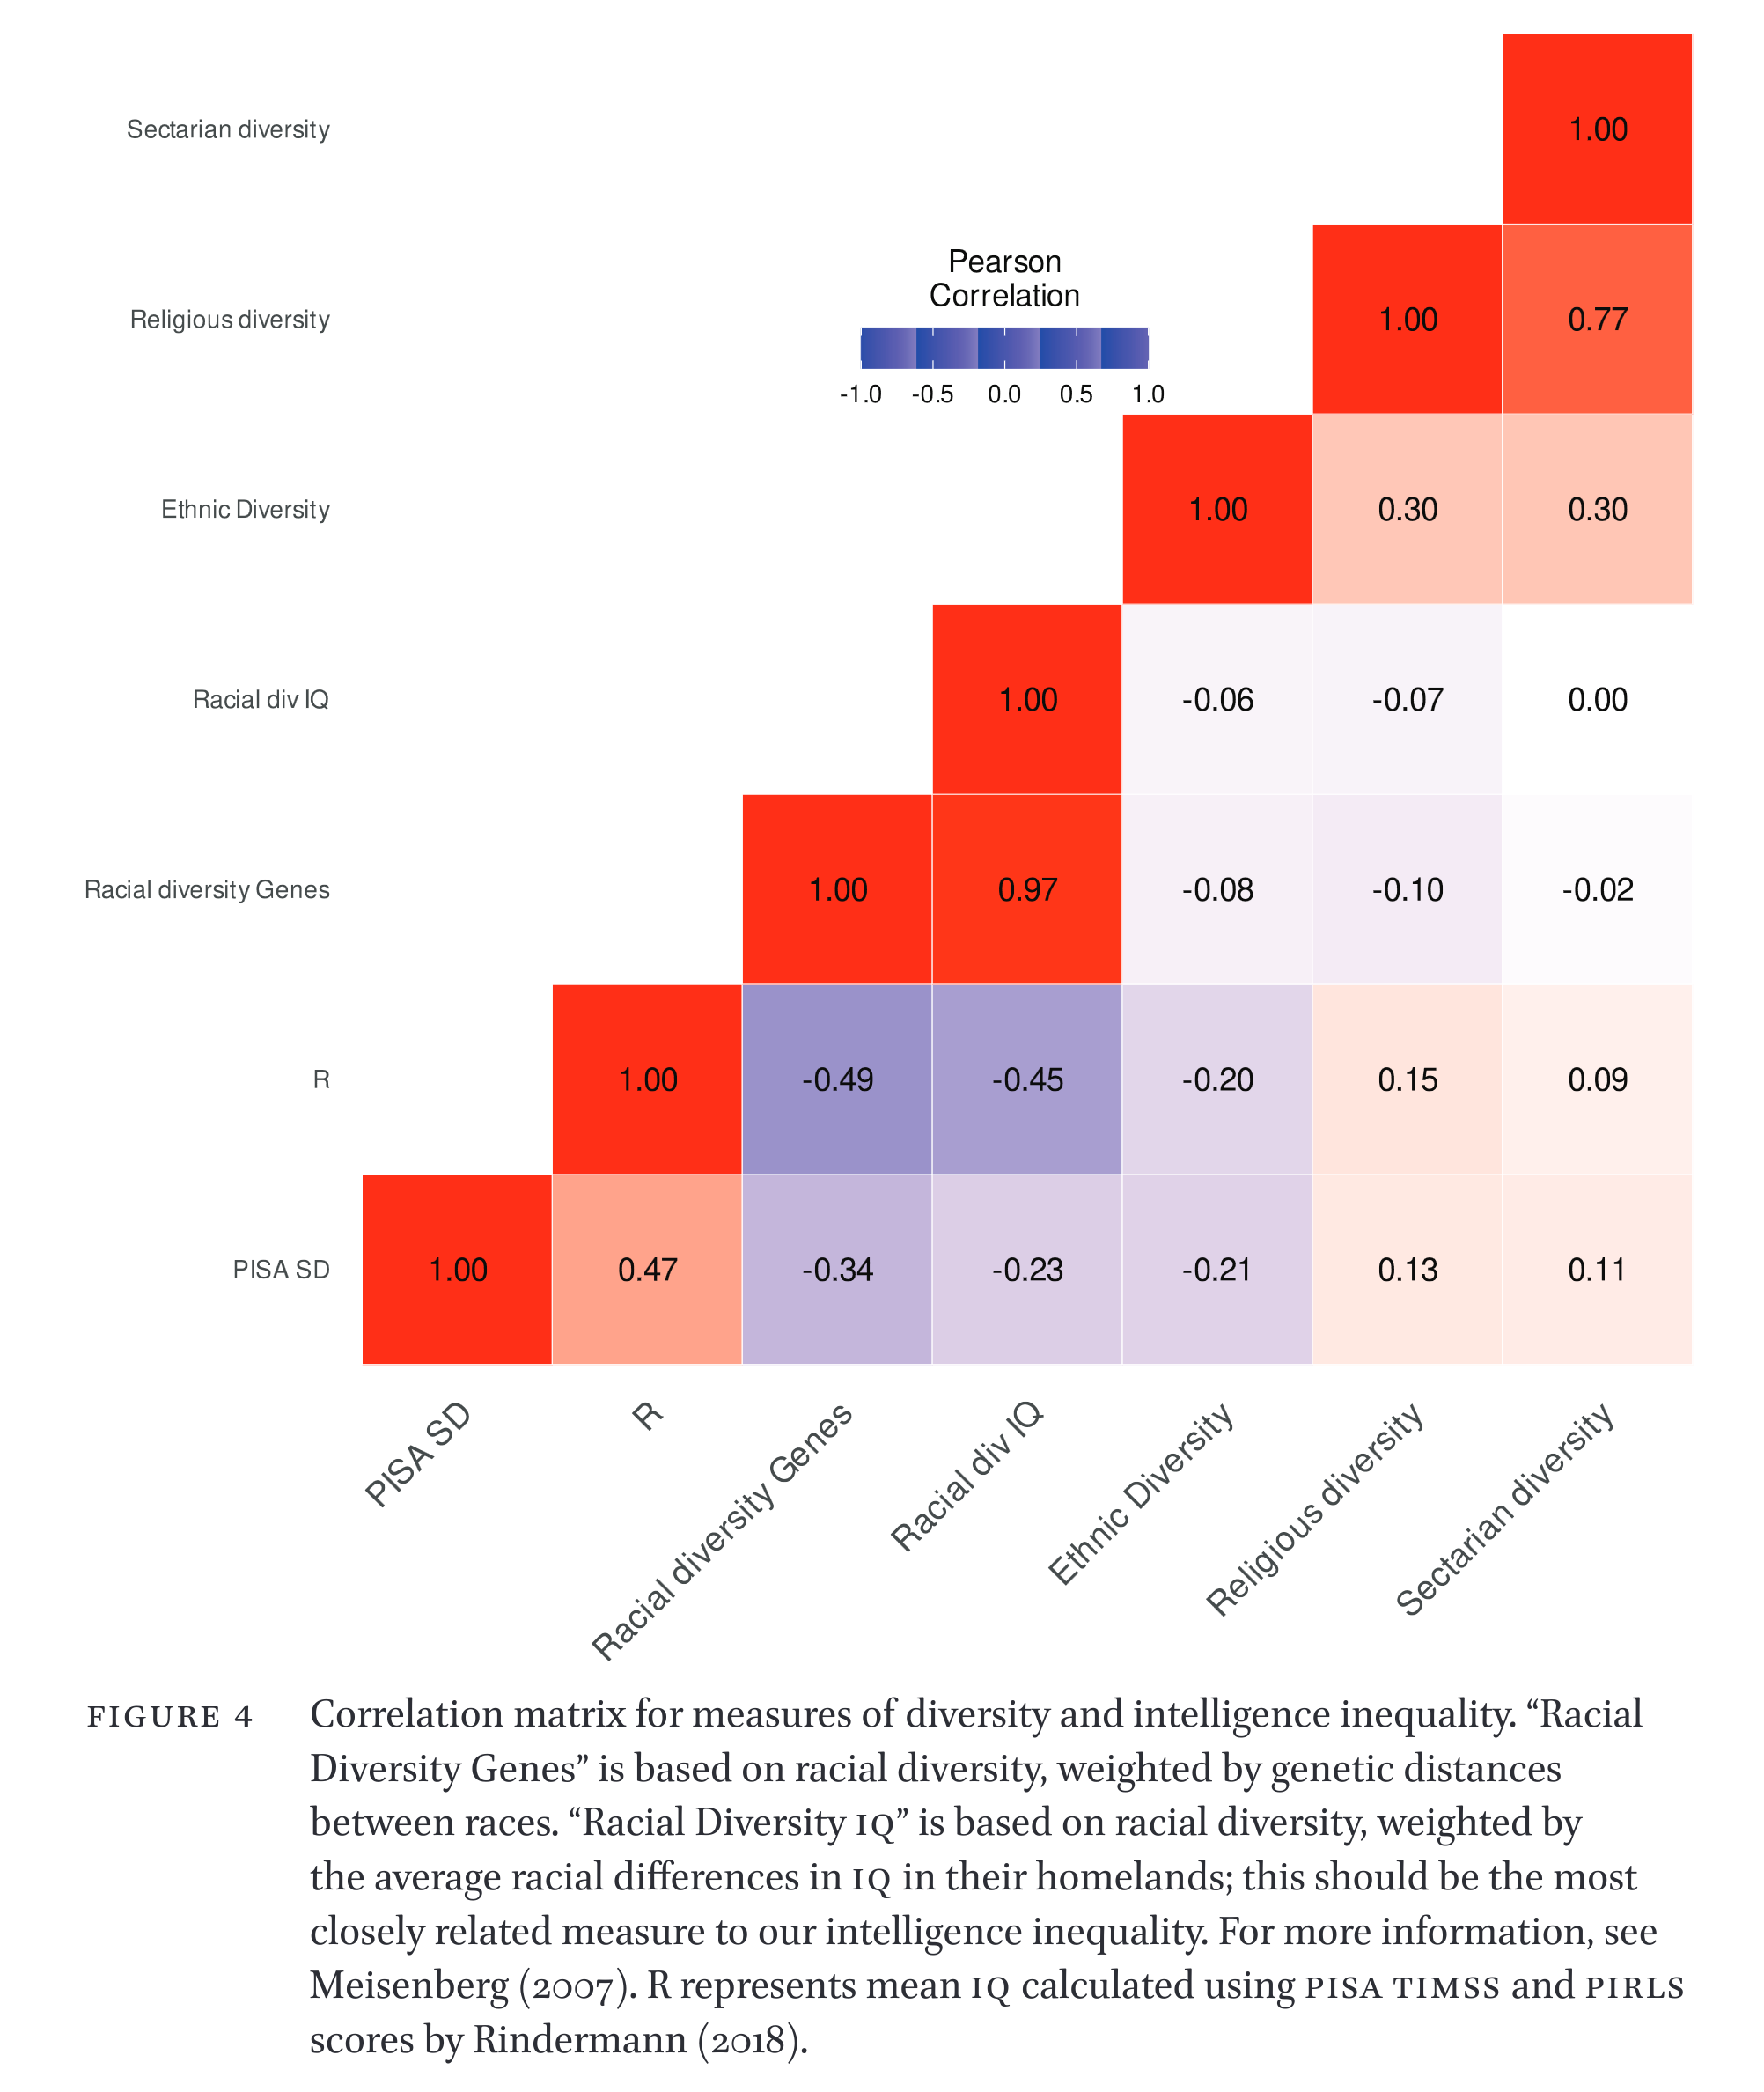
So the correlation don’t fit what we expect. We expect countries with more racial diversity, especially from groups with large differences, to show larger PISA variability, but they don’t, the correlation is negative. Weird. National mean intelligence predicts the variability, but it’s not obvious why that is the case. Neither does the PISA variability predict the gini coefficient (of income):
 We thought that maybe we had missed some other important confounder, say, something related to geography. So we added a spatial lag:

But nope, this didn’t work either. PISA variability either predicts nothing (non-sig.) or is negative, instead of positive. We also tried a regular continental dummies approach, but it produced about the same results. So what gives? Our discussion:
Across all of our models the empirical evidence fails to show any significant, positive relationship between intelligence inequality and income inequality and the estimated coefficient is consistently negative. These results conflict strongly with prior expectation as well as the results from our simulation. In addition, we found no evidence to suggest that the association between intelligence inequality and income inequality became more positive in countries with higher quality governments. This suggests that a lack of meritocracy is not the reason for the lack of any relationship between income inequality and intelligence inequality, although our sample size is too small to rule this hypothesis out entirely.
Our simulation showed that, with a sample size of 70 we should almost always obtain a positive estimate for our intelligence inequality coefficient, if the true relationship was driven by a similar rate of return to skill as is found in the US. However, under real world conditions our true power is lower, since we have imperfect measures of intelligence inequality, and we may suffer from unknown confounding factors, which don’t exist in the simulation.
Given the unexpected result obtained by the present analysis it is necessary to explore some hypotheses for the absence of an (or even negative) association between intelligence inequality and income inequality and put forward potential methods of testing these hypotheses.
The most obvious explanation for our results is measurement error within the PISA dataset. Estimates of intelligence inequality show weak or even negative correlations with the measures of ethnic, religious and racial diversity given by Meisenberg (2007) (Figure 2) which is implausible. Countries with high levels of corruption may prevent students of low intelligence from taking PISA tests in order to raise their national scores, this would also have the effect of lowering measured variation in intelligence but high levels of corruption are also generally associated with higher income inequality (Policardo and Carrera 2018). If this is not sufficiently controlled for by our quality of governance measures then this could be masking any true relationship between income and intelligence inequality. This argument is weakened however by the fact that some recent research has suggested the relationship may be causal in the other direction, from income inequality to corruption, rather than corruption causing income inequality (Policardo and Carrera 2018). On the other hand, the PISA SD results were fairly consistent across years, so the random measurement error (sampling error) of the country estimates based on multiple years of data should be fairly small. Whatever systemic errors exist, they are likewise very stable across time as seen by the relatively high correlates across years, which rules out some kinds of errors (cheating with sampling in one year but not in another). We used the available data such as it is. It is preferable that other measures of intelligence diversity be obtained to examine whether the PISA SD s work as intended.
One potential explanation of the results is that countries with greater intelligence inequality will, all else equal, contain a larger and more intelligent intellectual elite. If this intellectual elite were to advocate for and enact large redistribution policies then this may counteract or even reverse the expected effect of intelligence inequality on income inequality. Some support for this hypothesis is found in measures of the social attitudes within the United States. Carl (2015) found weak evidence of a U shaped relationship between intelligence and support for redistributive policies in general and statistically strong evidence that the intellectual elite are more likely to favor progressive taxation. If this relationship holds internationally, then a larger intellectual elite could be driving more progressive taxation in countries with high intelligence inequality.
To evaluate this possibility, future researchers could investigate the effect of the level of intelligence of a nation’s smart fraction on the level of redistribution that a government engages in. Alternatively, one could repeat the present analysis with the use of pre-taxation and transfer measures of income inequality as the outcome variable. If a positive association is found here, then this implies that governments are using taxation and redistribution systems to counter the natural effects of intelligence inequality on income inequality.
An alternative hypothesis is that modern economies require a degree of specialization exogenous to the level of intelligence inequality in a country. This would mean that in countries with lower intelligence inequality, the IQ difference between someone in high and low-skill employment would be smaller than in countries with higher intelligence inequality, but that the income gap between the job levels would remain the same. This hypothesis could be tested by estimating the IQ-income association by country and regressing the effect size by country against intelligence inequality, with a positive association providing support for this explanation. Although currently, IQ and income data is not available from a large enough sample of countries to make this analysis possible.
Which is basically TL;DR for we have no particular good hypothesis for the results. One idea we didn’t explore in the paper is that the PISA tests do not have sufficient range to measure the lower end of ability in low IQ countries. These low performing subjects then have estimates too far towards the mean, lowering the SD. This point is probably possible to examine by looking at the item level data. An item response theory fit of the data would show the reliability of scores across the range. This measurement error model would predict low reliabilities in the left tail of low IQ countries, such as those in south Asia, Morocco and so on.