Italy is well known for being sort of two countries in one. These differences are large and longstanding and cover pretty much every aspect of society in typical S factor style. More or less everything is better in the north, and the politics are different too. Not too surprisingly, there is a large political movement in the north of separating from the south. The usual social science explanations for this involves something about families, education, markets and so on, but there’s not really a good deeper explanation. The differences have been around since the renaissance, so they are difficult to explain by reference to formal schooling, which was nonexistent everywhere when the differences were noted. We sought to throw some light on this in our new paper, coauthored with the Italian researcher Davide Piffer.
- Kirkegaard, E. O. W. & Piffer D. (2022). Stability of Italian Regional Intelligence Differences for 150 Years. Mankind Quarterly.
Italy shows a strong north-south gradient in measures of well-being, with the northern areas being far wealthier than the southern. Less well known is that there is also a latitudinal gradient in intelligence. We combined numeracy scores based on age heaping data for Italian provinces from the censuses of 1861, 1871, and 1881 with modern data about scholastic ability from the INVALSI, and important social outcomes such as mortality and income (up to 107 provinces in analyses). We show that there is a strong stability of the intelligence differences across 150 years for the overlapping set of 69 provinces. Intelligence measured in the 1800s predicts overall well-being just as well as modern data, r’s .78 and .82, for age heaping and INVALSI, respectively. We discuss the findings in light of recent evidence of genetic differences in regional intelligence levels.
Let’s begin with the maps, Jayman style:
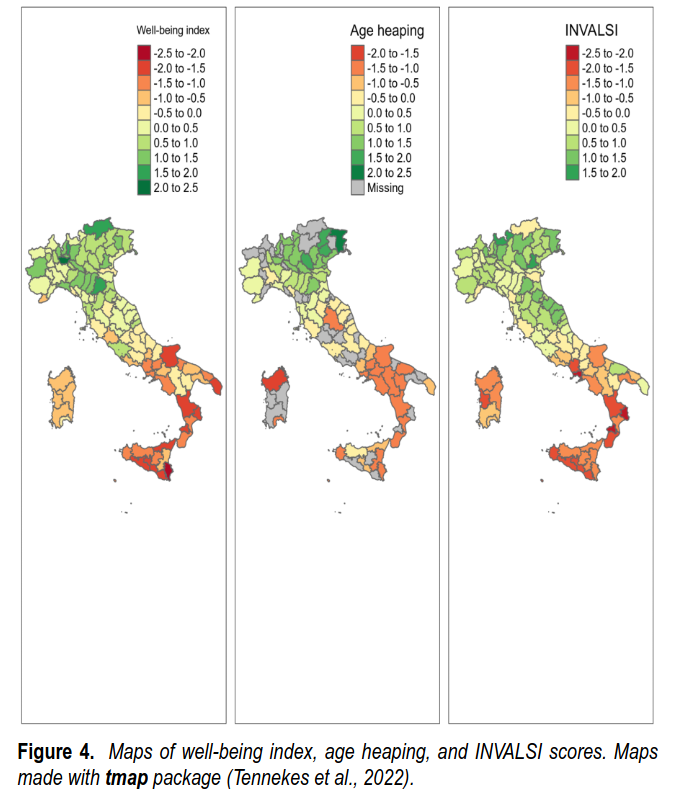
There’s 3 variables shown. The first is our well-being index. This is our general socioeconomic factor based on 14 indicators. The factor loadings look like this:

We get the expected pattern where good things have positive loadings and bad things have negative loadings. Recall that this analysis is done across about 100 provinces, not individuals. There are two deviates from this pattern. First, unadjusted mortality rate, which is probably because northern regions have more old people who died of COVID. But when using age adjusted mortality, it becomes negative as expected. Second, the robberies rate, which probably has to do with the immigration population and population density, both of which are higher in the center and north. Crime rates often show this kind of pattern in aggregate datasets. This has to do with the unit size, which is large enough to include high tier city districts with low tier city districts. If one used a smaller unit of analysis, in this case communes (there are about 8000), then this probably would probably go away. It wasn’t seen in our study of Belgian communes for instance.
Our second variable is a transformed age heaping score. Age heaping is the tendency of innumerate people to provide their own ages in rounded values, to nearest 5 or 10. Using census data, one can figure out the proportion of the population that is rounding their ages, which functions as a 1-item math test with a low ceiling. This is of course a very crude index of intelligence at the individual level, but at the aggregate level, it works well. Of course, we are not here claiming it is a perfect index, or that the sampling of census data from the 1800s are perfect, but it is pretty good. The age heaping in census data looks like this:

Using some mathematical tricks, one can convert such numbers into a linear scale. See the prior post on age heaping for African IQs.
The final variable are scores from the INVALSI, Italy’s mandatory scholastic test. Nothing too special about this one, but it works as a good proxy for intelligence, as scholastic ability will be nearly perfectly correlated with intelligence in aggregate units, and has a correlation of about .80 at the individual level.
The three variables obviously tell much of the same story — things are better in the north — but importantly, the age heaping scores are based on data from the 1800s, so one cannot easily claim reverse causality here. The correlations looks like this:

So things are correlated nicely all around. We added the geospatial measures as some have proposed these to be important. Peruvian researcher Federico Leon has proposed that altitude is important, but we don’t see anything here. In scatterplots, we see nothing too surprising. S factor and INVALSI:

Age heaping and S factor:

Age heaping and INVALSI:
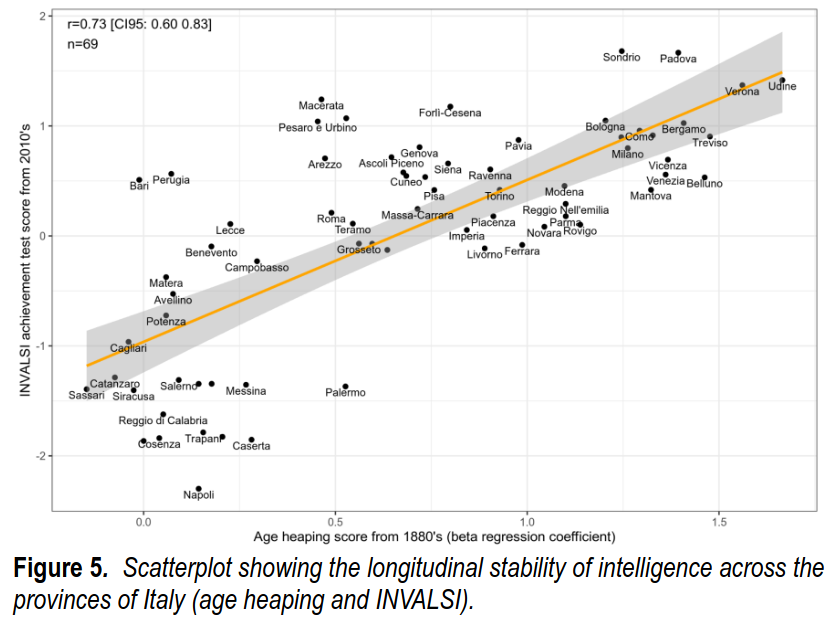
As the correlations are not perfect, one can of course speculate about some of the outliers. How was Palermo doing so well on age heaping as Rome (Roma), but then declined so much in modern data? Brain drain? Bad sampling in 1800s? Good local math education in 1800s? Who knows.
In terms of regressions:

Latitude shouldn’t really be much causal, but surprisingly, it actually beats INVALSI in explaining the S factor (model 4 top), as well as age heaping (model 4 bottom). This suggests that latitude may have some importance in Italy. Maybe the northern regions have non-intelligence personality advantages, e.g. industriousness, creativity, or maybe they benefit from having a shorter distance to trading partners in France, Switzerland and Austria. We can’t really say for sure with these data. Altitude and longitude again didn’t show anything. The null effects of longitude is a kind of negative test case since there’s no plausible causal explanation for how longitude per se could ever cause anything. There is some chance that our model results were somewhat of a fluke wrt. latitude. This variable is extremely strongly correlated with the intelligence measures (.85), so the model might get them confused with sample sizes of only 69 to 101. We hope to get similar data at the commune level, so this analysis can be done again.
Finally, this is not really the end of the ongoing hereditarian Italian studies. In the same issue of Mankind as us, Richard Lynn pitched in with some new Sicilian IQ data, confirming the usual findings:
- Lynn, R. (2002). New Evidence Confirms that the IQ in Sicily Is Lower than in the Mainland. Mankind Quarterly.
A recent study of a representative sample of 6 to 11 year olds in Sicily tested with the Coloured Progressive Matrices obtained a British-scaled IQ of 92. Literature review shows that this result is in agreement with earlier studies using psychometric IQ tests in the Italian provinces. Keywords: Italy, Sicily, Intelligence, Coloured Progressive Matrices
Summary table:

I think Buy is fraudulent, but Lynn reports it here anyway.
The new data he reports is from Smirni, which found an IQ of 92 in Sicily on the colored progressive matrices.
Also 6 months ago, and also in MQ, Piffer & Lynn reported the first genetic results, showing that the intelligence gaps are likely substantially genetic in origin. This is of course what hereditarians were always saying based on various indicators of ancestry which show North African admixture in the south. These results are still weak owing to small samples, but they go the right way:

What this shows to me is that hereditarianism keeps being a productive research program. Predictions are made based theory and prior findings, these are systematically tested in different countries, with different methods, and all the results are brought together to improve our understanding, and things keep fitting reasonably well.
Finally, we have some more exciting results using ancient genomes in the works. Stay tuned!