Back in 2021, Russell Warne wrote a nice summary article about race differences in intelligence:
- Warne, R. T. (2021). Between-group mean differences in intelligence in the United States are> 0% genetically caused: five converging lines of evidence. The American Journal of Psychology, 134(4), 480-501.
The past 30 years of research in intelligence has produced a wealth of knowledge about the causes and consequences of differences in intelligence between individuals, and today mainstream opinion is that individual differences in intelligence are caused by both genetic and environmental influences. Much more contentious is the discussion over the cause of mean intelligence differences between racial or ethnic groups. In contrast to the general consensus that interindividual differences are both genetic and environmental in origin, some claim that mean intelligence differences between racial groups are completely environmental in origin, whereas others postulate a mix of genetic and environmental causes. In this article I discuss 5 lines of research that provide evidence that mean differences in intelligence between racial and ethnic groups are partially genetic. These lines of evidence are findings in support of Spearman’s hypothesis, consistent results from tests of measurement invariance across American racial groups, the mathematical relationship that exists for between-group and within-group sources of heritability, genomic data derived from genome-wide association studies of intelligence and polygenic scores applied to diverse samples, and admixture studies. I also discuss future potential lines of evidence regarding the causes of average group differences across racial groups. However, the data are not fully conclusive, and the exact degree to which genes influence intergroup mean differences in intelligence is not known. This discussion applies only to native English speakers born in the United States and not necessarily to any other human populations.
This paper is based on a chapter in Warne’s 2020 book, In the Know: Debunking 35 Myths about Human Intelligence. It’s a good book giving an introduction to the field while disproving popular claims. It basically serves as a kind of FAQ website, only in book format.
In response to the Warne review book, our team conducted a bunch of new tests, and the resulting paper has just been published:
- Fuerst, J. & Shibaev, V. & Kirkegaard, E. O. W. (2023). A Genetic Hypothesis for American Race/Ethnic Differences in Mean g: A Reply to Warne (2021) with Fifteen New Empirical Tests Using the ABCD Dataset. Mankind Quarterly, 2023 June
Intelligence tests are excellent predictors of school and job performance, and racial/ethnic differences in mean IQ are common. Based on five lines of evidence, Warne (2021) builds a case for partly genetic causes of differences in general intelligence (g) across American self/parental-identified race or ethnicity (SIRE). Based on a careful reading of Warne (2021) and the authors he cites, we generated 15 predictions flowing from a partial genetic hypothesis. These predictions concern (1) mean cognitive differences and Spearman’s hypothesis, (2) measurement invariance across European genetic ancestry, (3) high within-group heritability and low shared environmentality, (4) admixture regression for g, (5) polygenic scores, (6) brain volume, and (7) results based on the method of correlated vectors. We used the Adolescent Brain Cognitive Development Study sample (N = 10,245) to test these hypotheses using classical and state-of-the-art statistical techniques. Decomposition of variance using twins showed that the heritability of intelligence and of brain/intracranial volume estimates were, respectively, moderate and high for both the White and the non-White subsamples, while the variance attributable to shared environment was low. Within SIRE groups, both genetic ancestry and education-related polygenic scores (eduPGS) predicted both brain volume and g. Moreover, brain volume was weakly but statistically significantly related to g (r = .14 to .25). Path and mediation analysis showed that total brain volume explained approximately 15% of the association between European ancestry and g and also explained approximately 8% of that between eduPGS and g. Finally, based on the method of correlated vectors (MCV), a positive manifold was found for genetic, brain volume, and ancestry/SIRE-related variables. We conclude that the results support the hypotheses tested and are in line with a partial genetic hypothesis.
The article is 74 pages long (!), but here I will just be summarizing the main findings. But what is the dataset? It’s the fabulous ABCD:
The ABCD is a collaborative longitudinal project involving 21 sites across the US. The National Institute of Health (NIH) supported ABCD is the largest longitudinal study of brain development conducted in the US to date. Approximately 11,000 9-10-year-old children were sampled at baseline, between 2016 and 2018, using a probabilistic sampling strategy. The ABCD subjects were limited to children who were fluent in English and who did not have severe medical, neurological, or psychiatric conditions. The children are broadly representative of healthy US children in this age range. Informed consent was provided by the parents.
So it’s a rather large dataset. Sadly, you cannot just download it somewhere. You have to apply for it via some kind of academic or research institution and go through a lot of paperwork.
Intelligence testing was based on 11 tests, so the g factor should be relatively good (construct valid) and reliable:
The following cognitive measures were given at baseline: the seven NIH Toolbox® (NIHTBX) neuropsychological battery tests, NIHTBX Wechsler Intelligence Scale for Children’s Matrix Reasoning, the Little Man Test (efficiency score), the Rey Auditory Verbal Learning Test (RAVLT) immediate recall, and RAVLT delayed recall. Regarding the first seven of these, the NIHTBX neuropsychological battery was designed to measure a broad range of cognitive abilities. It consists of seven tasks which index attention (Flanker Inhibitory Control and Attention Task), episodic memory (Picture Sequence Memory Task), language abilities (Picture Vocabulary Task & Oral Reading Recognition Task), executive function (Dimensional Change Card Sort Task & Flanker Inhibitory Control and Attention Task), processing speed (Pattern Comparison Processing Speed Task), and working memory (List Sorting Working Memory Task) (Akshoomoff et al., 2014; Weintraub et al., 2014; Thompson et al., 2019).
The g factor was extracted using a structural equation model (SEM), and 100 was defined as the overall American mean. This means that it isn’t exactly comparable with the usual national IQs, but is slightly lower and has a wider distribution. Alternatively, the ABCD provides its own procomputed g-factor based on the NIH Toolbox tests only.
Other variables of interests were the brain related variables, also used in our prior study of the same dataset. Genetic ancestry was estimated based on array data, which was also used to score the polygenic scores (EA3 variants). The reason not to use EA4 was that it is not allowed to use this for ethnic differences, and we originally submitted this paper to another journal that might care about such things. Furthermore, Davide Piffer has found that EA4 is more biased for non-European ancestries than EA3 is (work not published yet).
A few prior, rather small studies have examined the heritability of brain size (or volume), finding very high values (about 90%). The matter is important because one can measure brain size with high precision using MRI data, and is measured on a ratio scale (cm³), so there cannot be any big measurement issues. The same kind of Jensen variance argument applies to brain size differences as it does to intelligence. Brain size differences by race show up even before birth, where most environmental factors cannot even theoretically be in play. The finding of a very high heritability within race makes it nearly certain that the race differences are also largely genetic in origin. To admit this would be defeat for egalitarians, because brain size is causally related to intelligence, and thus any genetic brain size differences must also result in genetic intelligence results unless there is a counteracting factor of at least equal force. The ABCD has some siblings, including twins, so it is possible to verify the previous estimates of the heritability of brain size:

The heritabilities are sky-high and fairly consistent within the 4 major groups under study, despite very small sample sizes. If anything, they are larger for the non-White groups for whatever reason. Perhaps this is just sampling error, or maybe their brain sizes finalize more early in development, resulting in higher heritabilities at age 10. Because of the sampling error with the small samples, it is wiser to focus on the White vs. non-White grouping. The brain size heritabilities were 76% for Whites and 79% for the non-Whites.
Similarly, one can look at the heritability of intelligence:
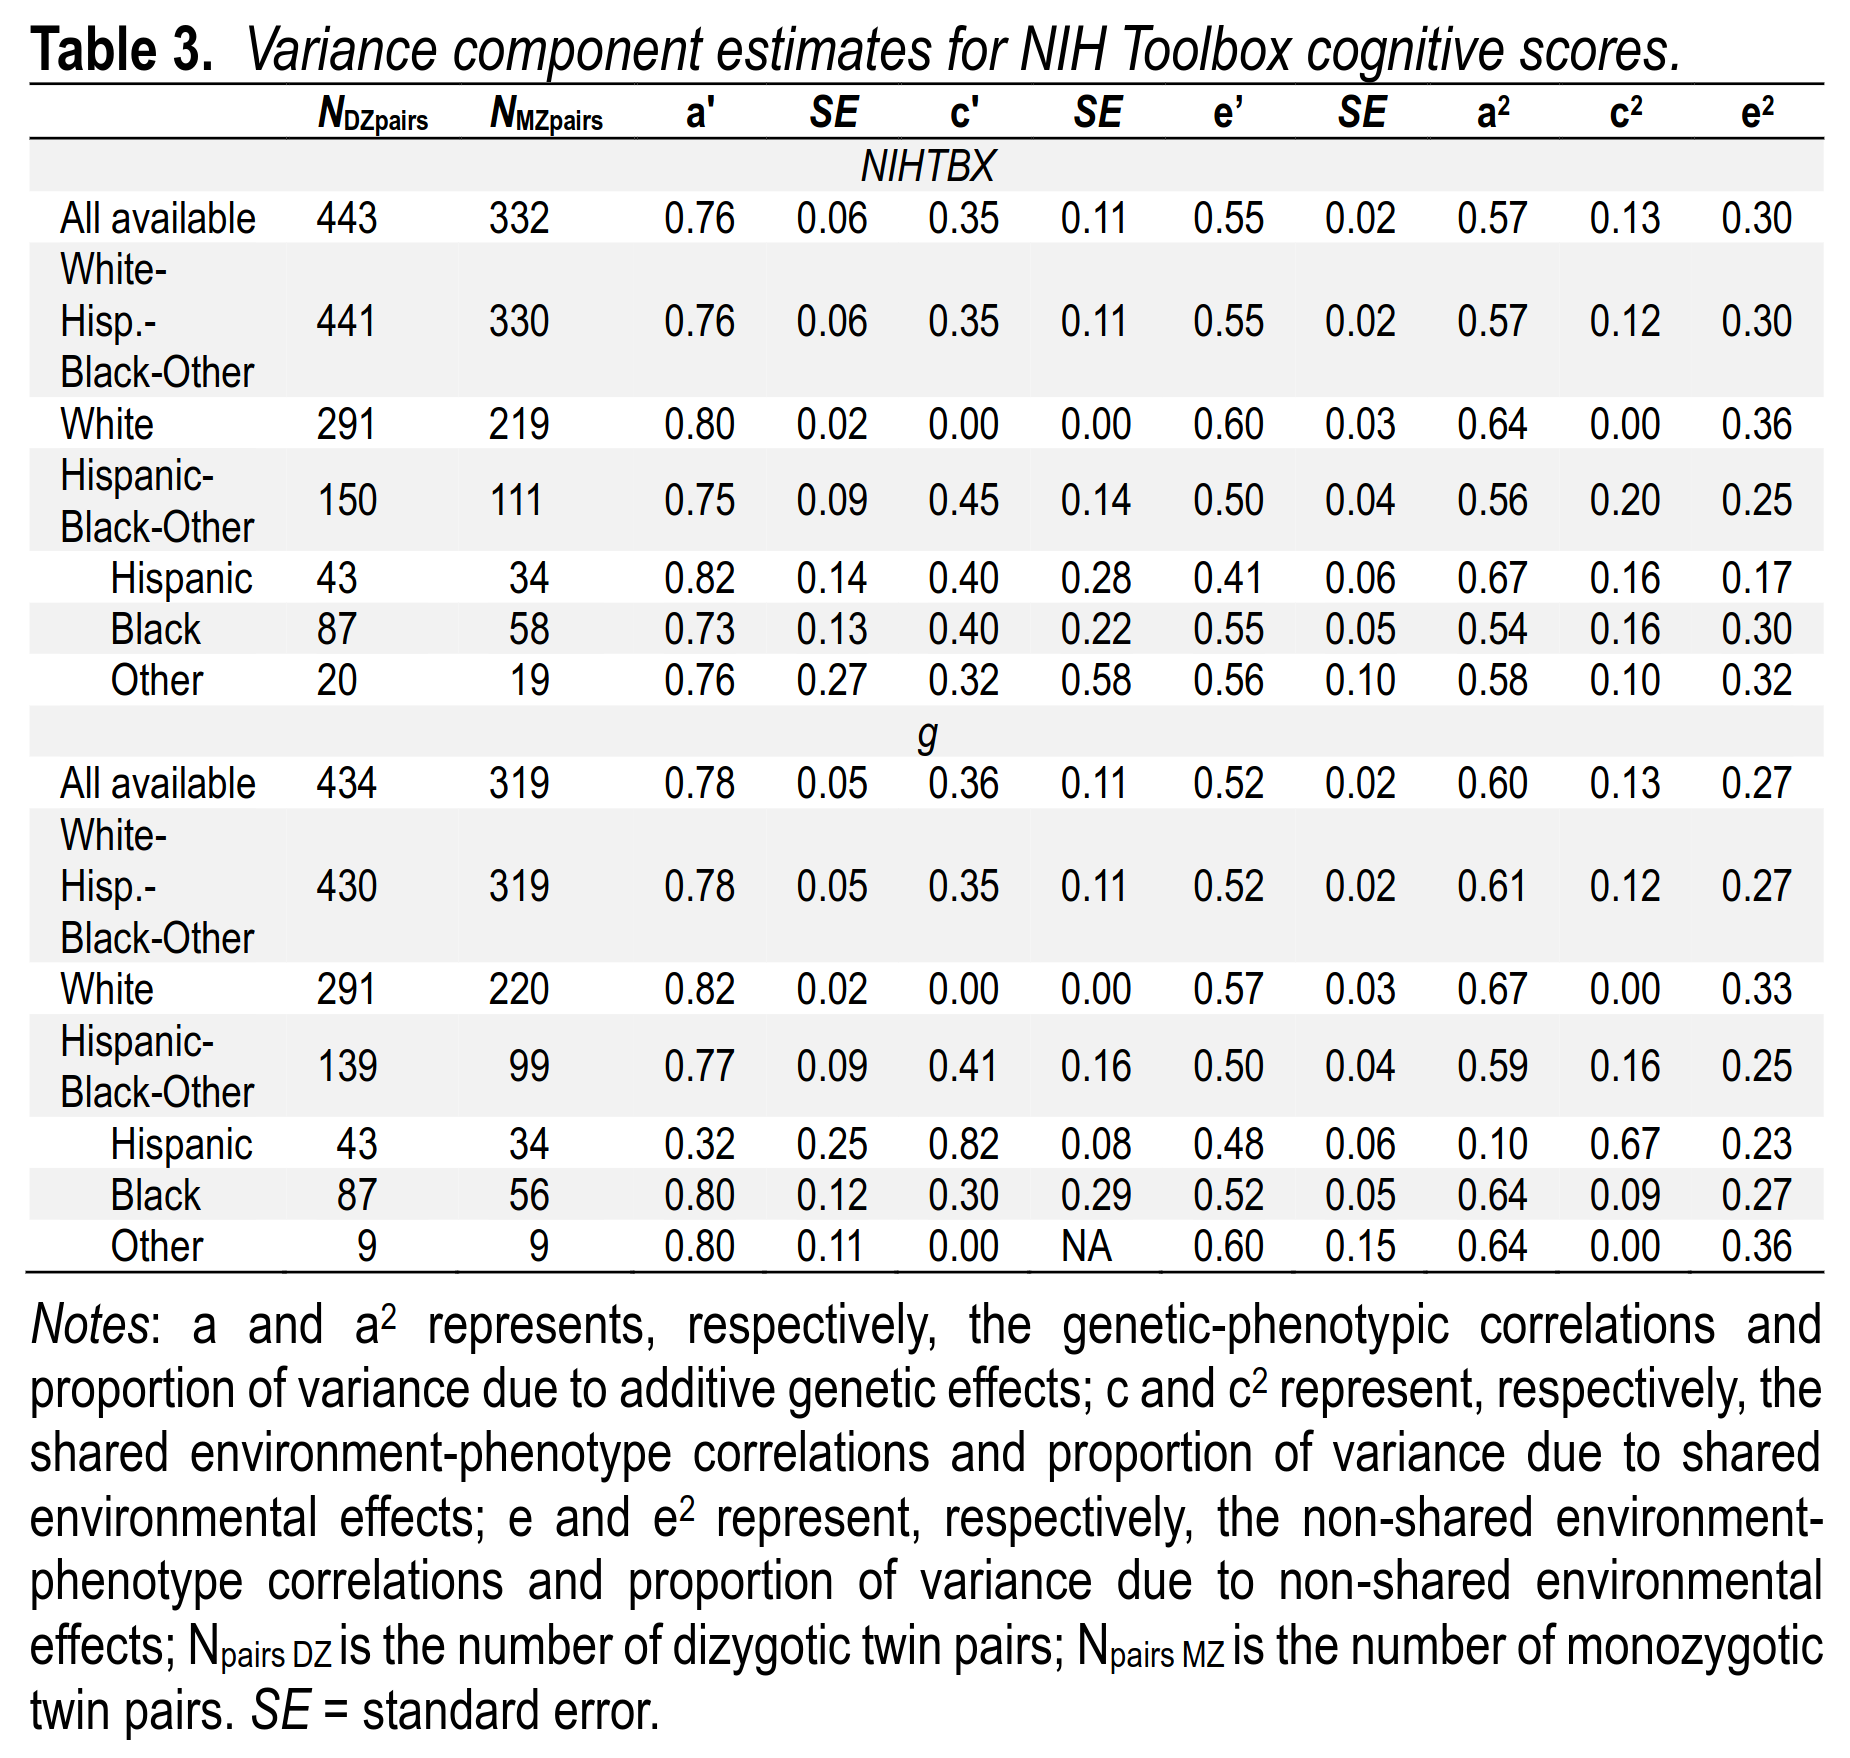
If we focus on the theoretically superior g scores as opposed to the NIH Toolbox premade scores, we see the heritabilities for intelligence are 67% for Whites and 59% for non-Whites. Consistent with the much debated Scarr-Rowe hypothesis, there is some larger shared environment component for the non-Whites, but we can’t make too much of it due to the sample sizes. The difference is probably not beyond what one could expect by chance. If anything, it seems shared environment is too low in the White sample.
In terms of genetic ancestry, the sample is somewhat heterogeneous as African Americans (Blacks) are a hybrid group between Europeans and (West) Africans, and Hispanics a mostly hybrid group between Europeans and Amerindians, with some small proportion of African mixed in. Graphically, it looks like this:

The colors show the race of the child as reported by the parent (usually mother). The Other group consists of various admixed people, whose ancestry was also from the same three ancestry components (Black-White mixed, American Indians etc.).
Now we are ready to look at the main results. The goal here is to predict intelligence from a variety of factors including genetic ancestry, parental social status (SES), parent-reported race (social race), family immigration history, and whether someone was born in the USA (almost all children were). Here’s the scary looking table: 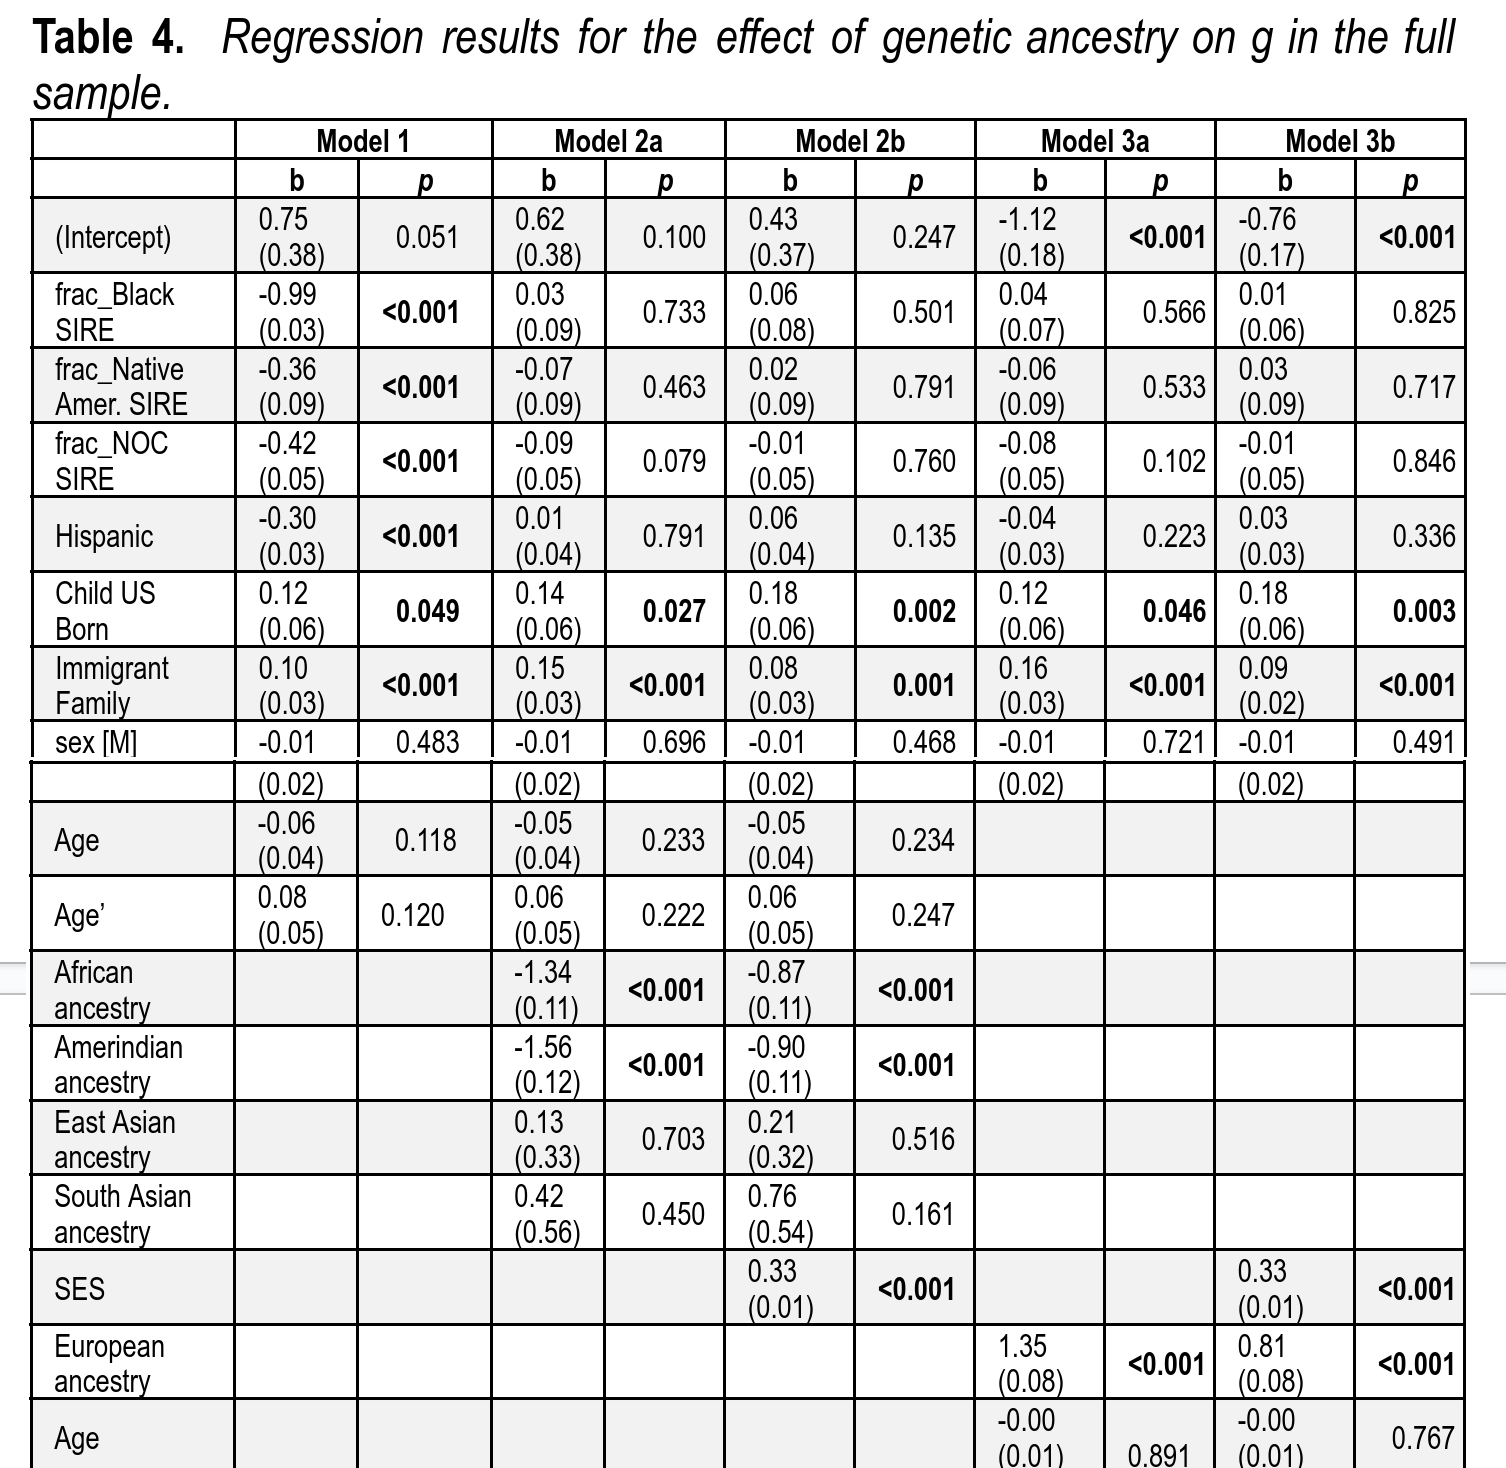
The variables are standardized, so the betas can be compared for importance, except for the ancestry variables because these have a natural interpretation. For the non-European ancestries, the value shown is the estimated effect of going from 100% European ancestry to 100% of either African or Amerindian ancestry. By comparing models 1 and 2, one can see that social race can predict intelligence, but not when one includes genetic ancestry (i.e. biological race) in the models. In other words, social race is almost entirely a non-causal proxy for genetic ancestry. In simpler terms, it doesn’t matter what race you or your mom claims you are for the purposes of predicting intelligence.
There is evidence of a slight verbal bias in the measurement of intelligence insofar as being born in the USA has a small positive effect (but note the dubious p values). Interestingly, we see an equally small but certain effect of being from an immigrant family. The effect is positive, so children of immigrants do somewhat better than expected. This is an effect of selective immigration into the USA, so one might praise this as an immigration policy that works to some extent. If we look at model 2a, we see that the slopes for African and Amerindian ancestry are -1.34 and -1.56. So the model results show that holding the other variables constant, a person with 100% African ancestry is estimated to be 1.34 z below the intelligence level of a 100% European person. Likewise for Amerindian ancestry. Model 2b adds parental SES to the model. This reduces the effect of ancestry, but not that much. The slopes are now -0.87 and -0.90. The final models repeat this exercise but simplifying ancestry to just European% vs. non-European%. Since the sample’s non-European ancestry is African and Amerindian and these have similar slopes, the slope for European ancestry should be comparable to the others, and it is. Based on this result, we can say that parental SES can explain at most (1.35-0.81)/1.35 = 40% of the relationship between genetic ancestry and intelligence. I say at most because parental SES measures parental intelligence, and insofar as this also differs for genetic reasons, the model is overcontrolling for genetics indirectly. This fallacy is extremely common, so it has a name: the sociologist’s fallacy. It is so named because sociologists almost always assume that their social variables are causal in themselves, rather than reflecting other phenotypes. Most research, however, indicates the opposite.
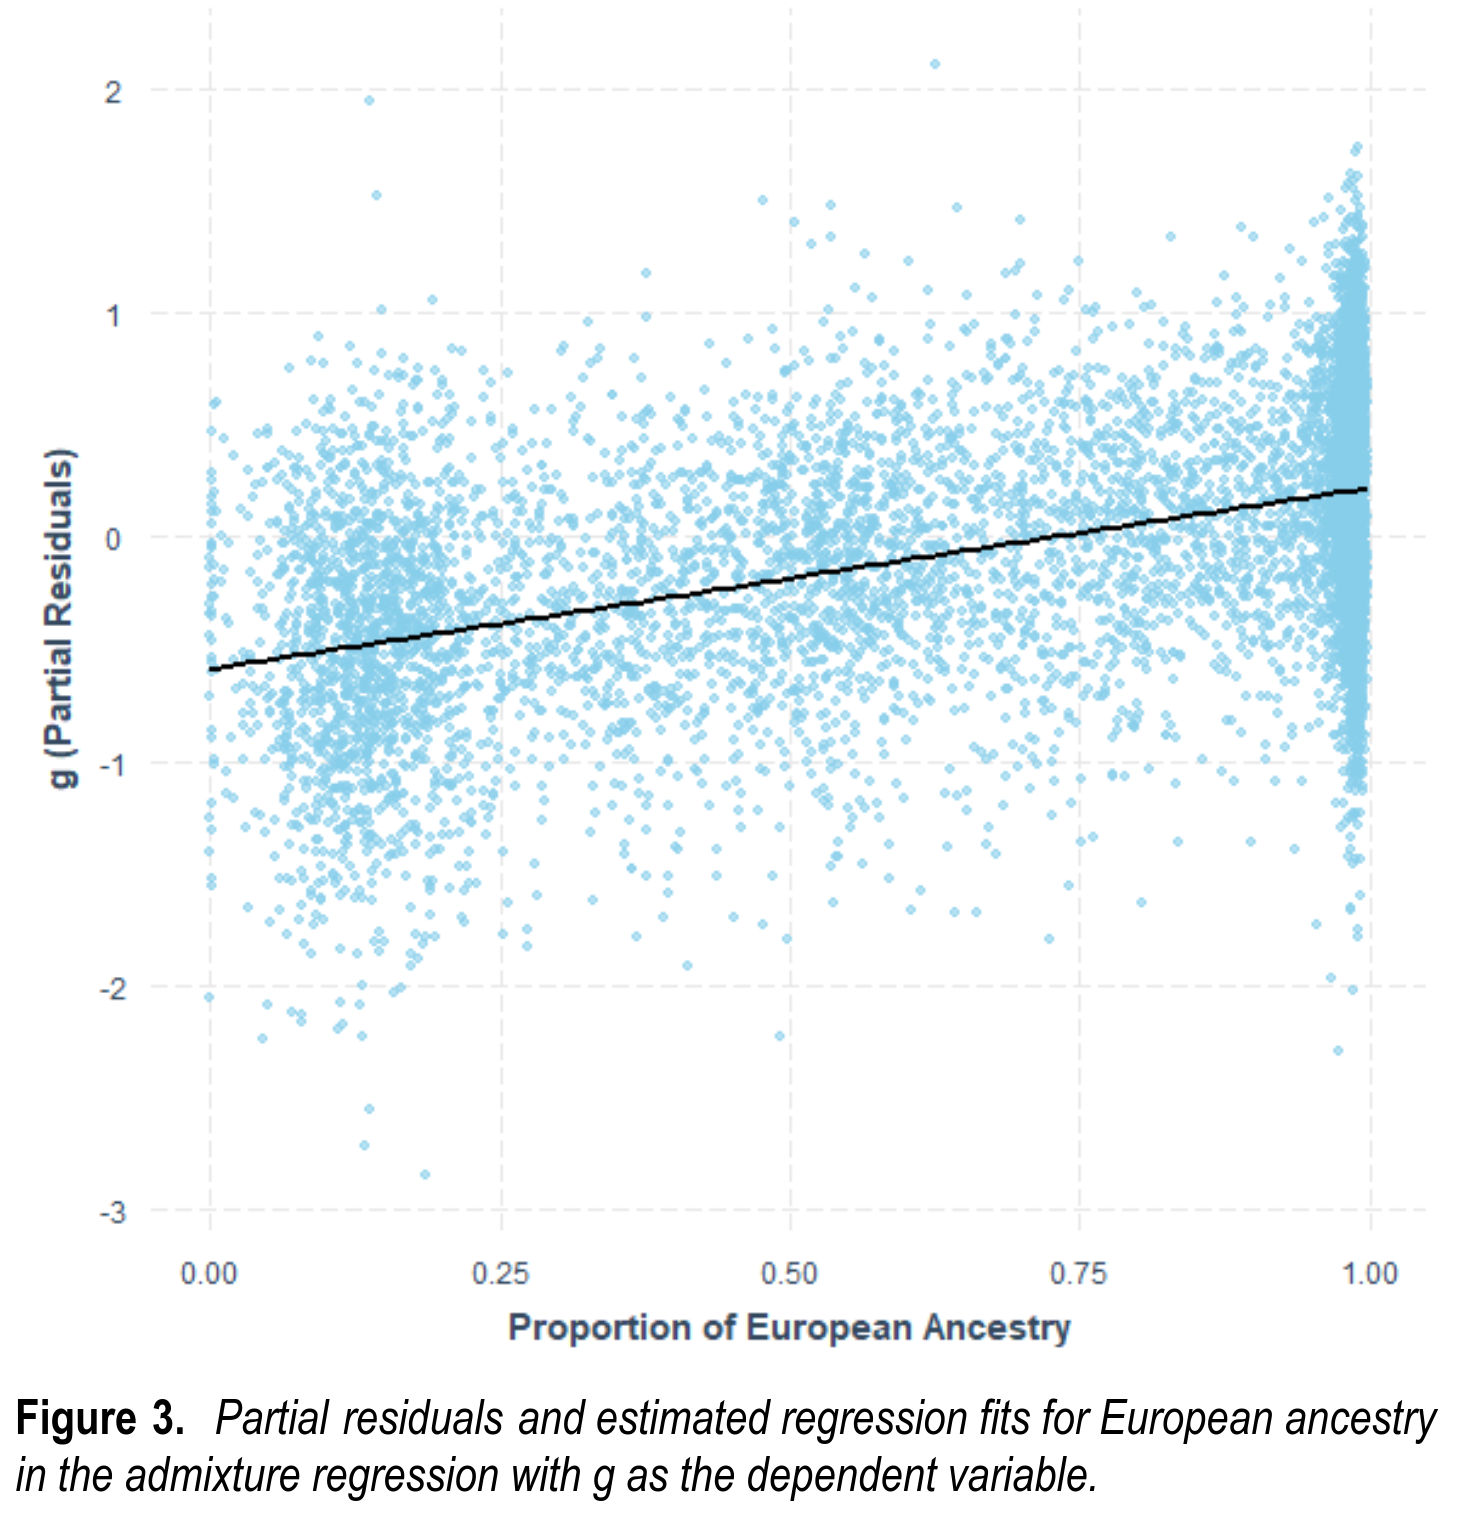
One can also show the results from model 3b in a plot, which includes the overcorrection for parental SES:
In the hereditarian model, genetic ancestry is not really the same as genetic intelligence, of course. Rather, through evolution genetic ancestry has come to be statistically linked with the genetic variants for intelligence. Polygenic scores (PGSs) are an attempt to directly measure the genetic basis of intelligence, or education as a proxy. The central concern, then, is whether these genetic prediction models work across all races or just within Europeans:

A variety of studies have already shown that the polygenic scores are less valid the most distant the group is from Europeans. We sort of confirm that finding here. The polygenic scores work about equally well for Whites and Hispanics, and less well for Africans. Hispanics have a large European ancestry component, so it is not so surprising they are similar. The polygenic scores work even better in the “Other” group, probably because it has a mix of many ancestries and some large group gaps, as well as increased variance. Somehow the 20 principal components failed to properly adjust for this. At least, that’s my guess. To note, one trick to make the validities differences by group seem larger than they are is to square the correlations (or betas) so to obtain the variance explained. This is a bad practice, as that’s a nonlinear, hard to interpret metric. The real difference in predictive validity of the education PGS is 0.16/0.26=62%, i.e., a decline of 38%. If we use the bad method, we get pseudo-R2’s of a 62% decline.
For good measure, we also looked at the sibling pairs to test the causality of the PGSs. These are known to be somewhat confounded by family structure and family SES despite the use of genetic principal components in the GWASs:

We find that the shrinkage is less than previously reported, about 20% smaller among siblings, not 50% as sometimes seen. I’m not sure what the cause of this discrepancy is.
Furthermore, the validity of brain size to predict intelligence could also be seen within each group, and was about equivalent (as also reported in our big neuroscience paper):
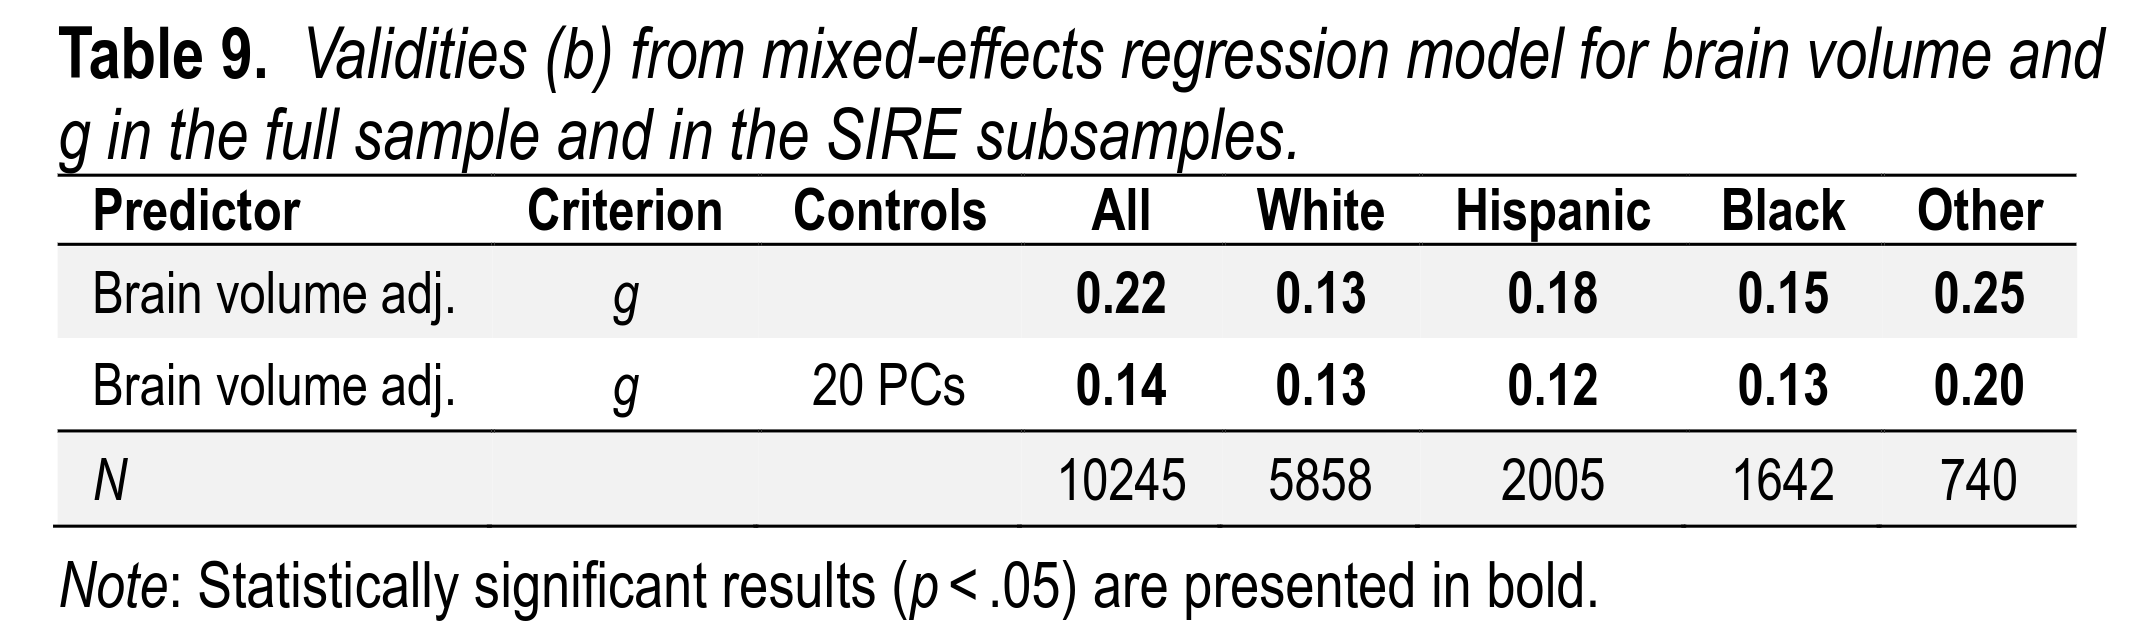
Finally, this validity of brain volume for intelligence can also be observed among sibling pairs, as has been previously reported:
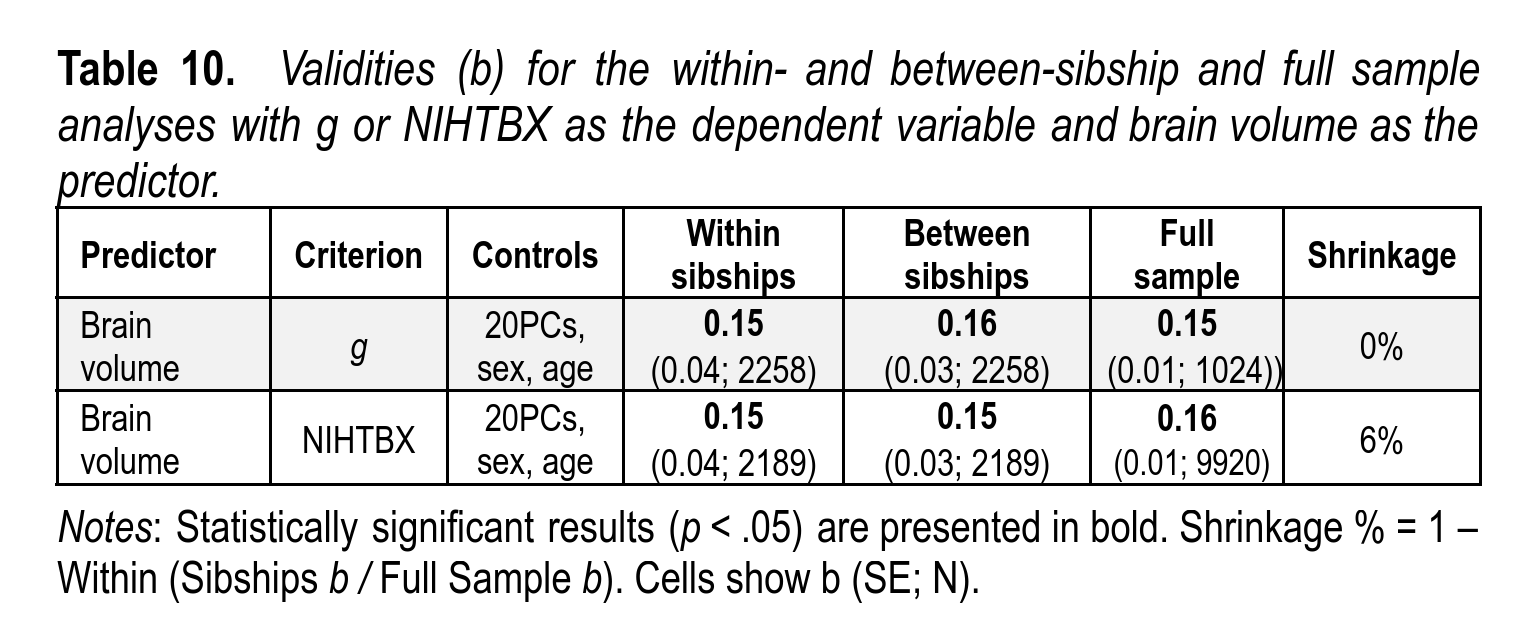
This provides good evidence that the effect seen is causal, not just a proxy for some family variable that wasn’t measured. The validity is not amazing, but nonetheless real.
Going further, one can also predict brain size as a function of genetic ancestry and the other variables:
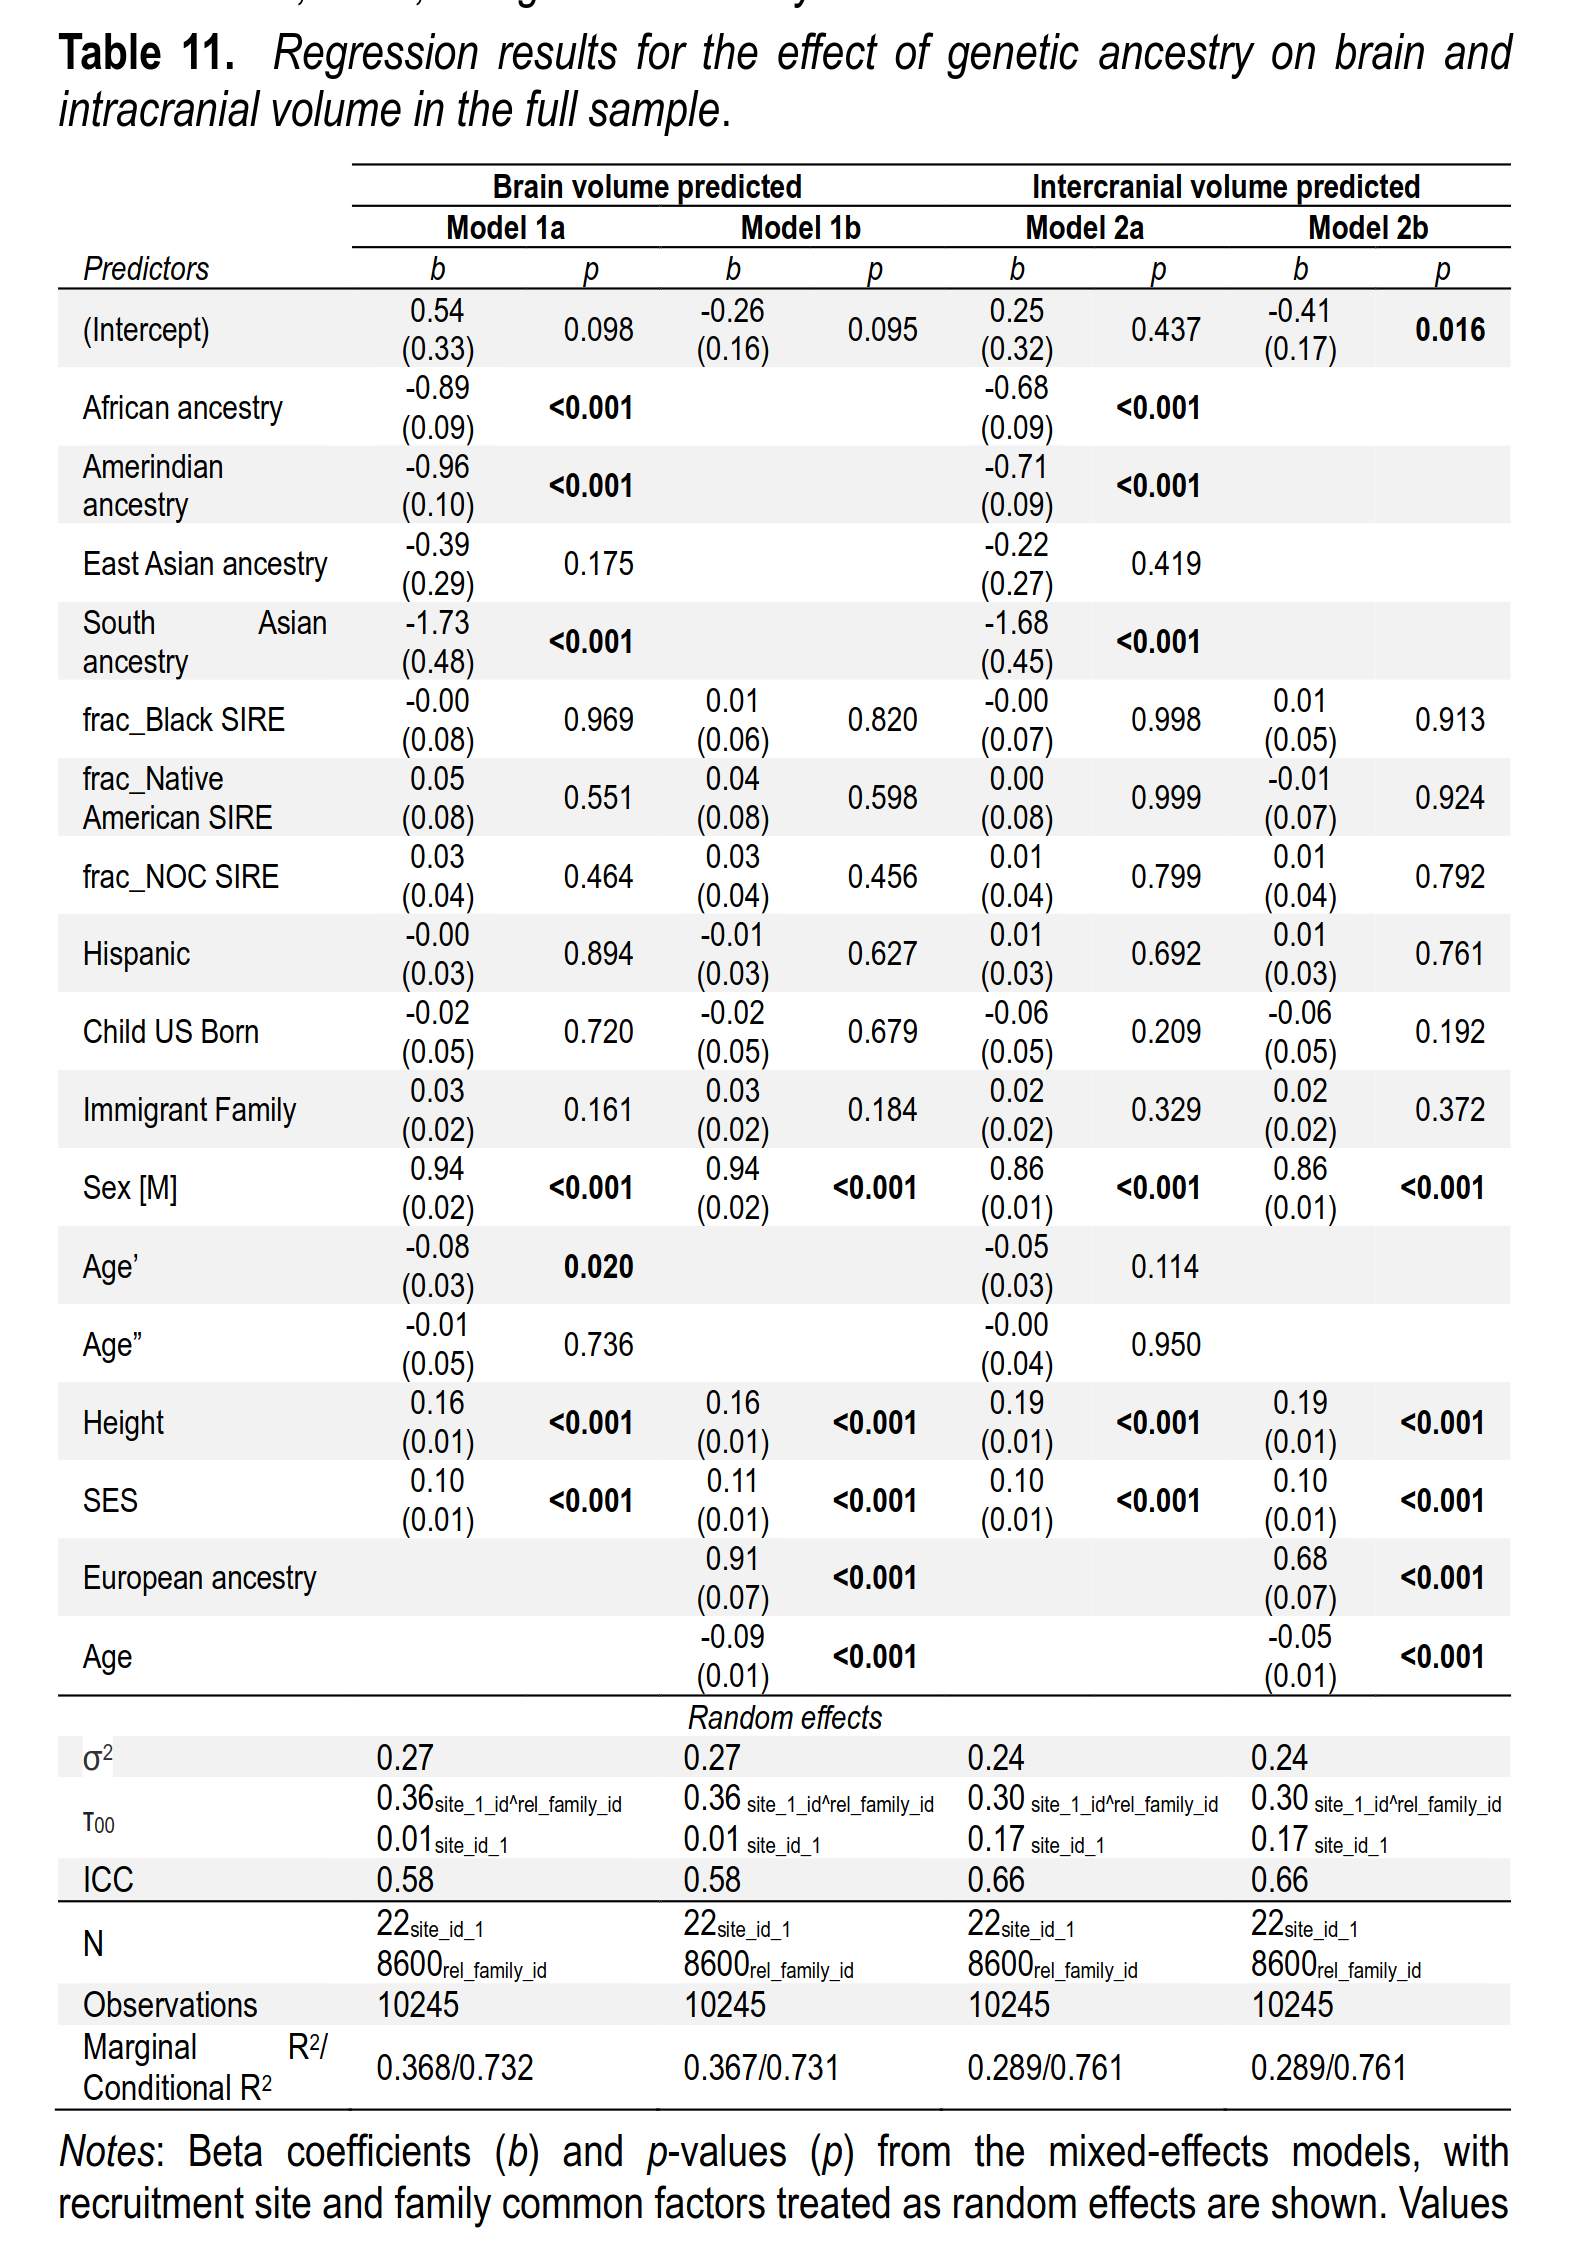
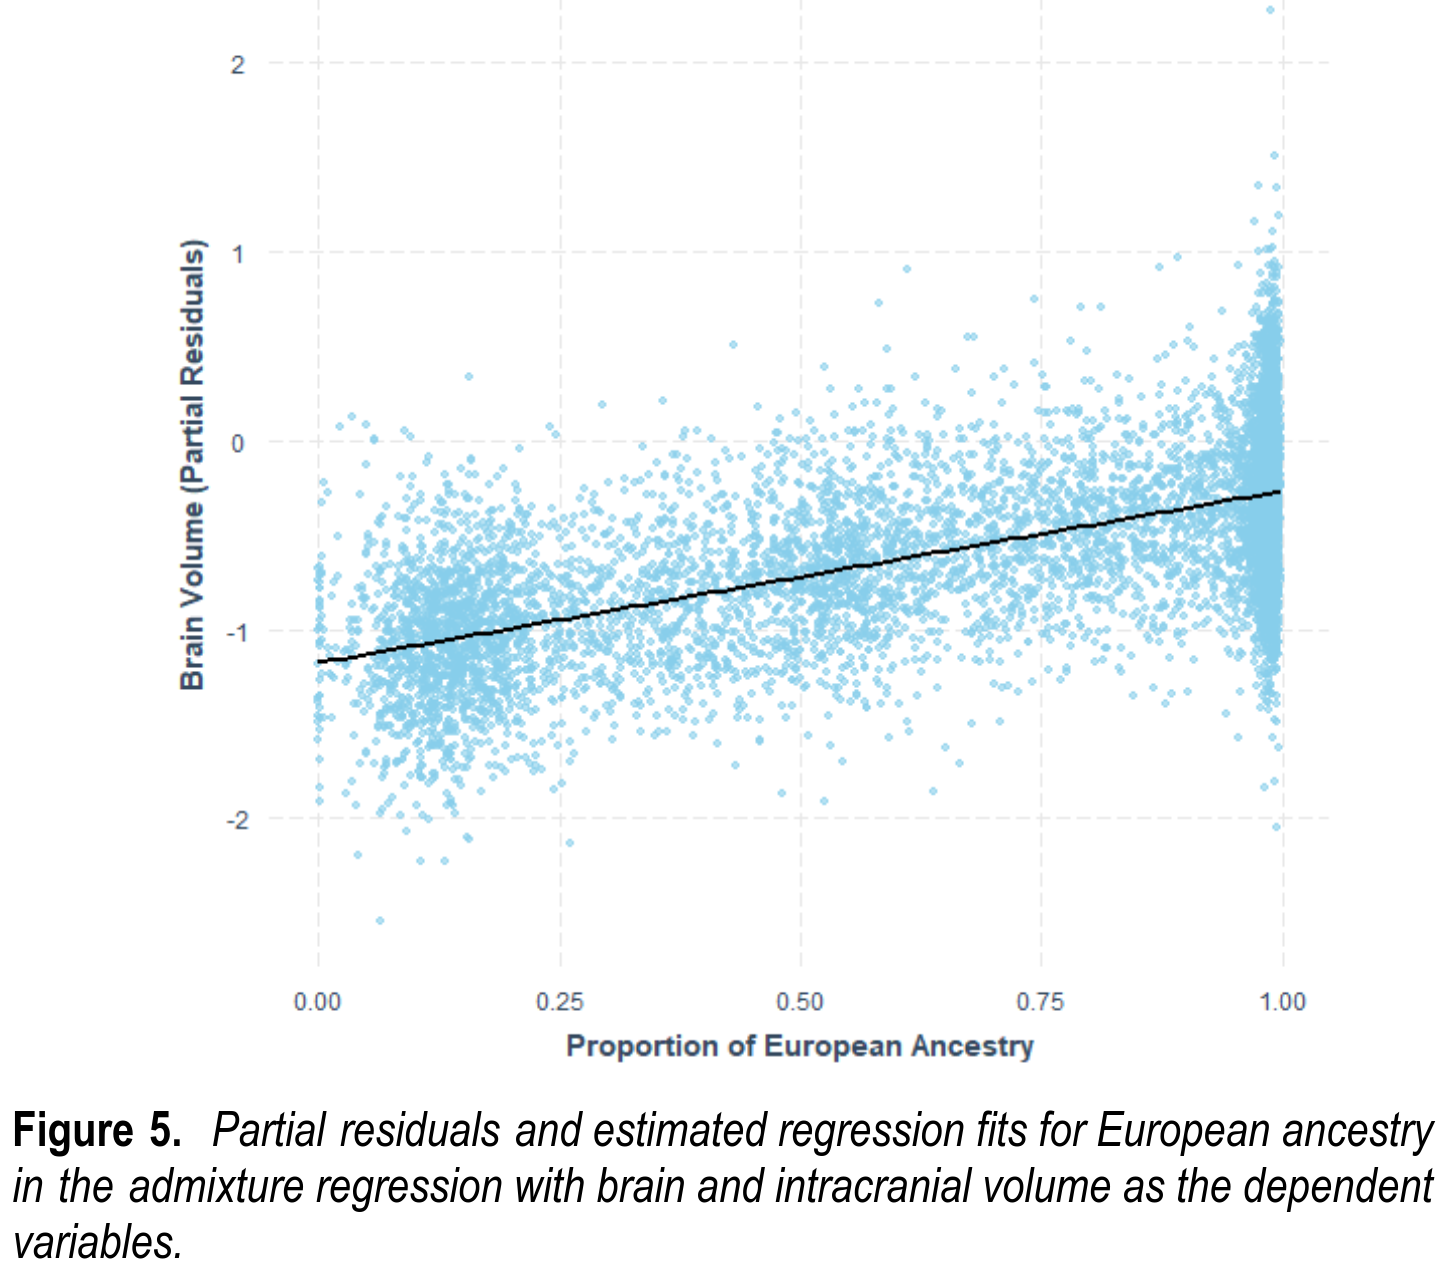
This repeats the modeling from above, just changing the dependent variable to be brain size instead of intelligence. Even controlling for a host of factors, including parental SES, European ancestry predicts brain size with a slope of 0.91. In other words, going from 0% to 100% European ancestry statistically makes you brain become 0.91 standard deviations larger. As before, social race, and everything it’s associated with, has no effect beyond genetic ancestry. One can also see the same result in a plot:
Getting closer to the causality of parental SES, we also analyzed the adopted children in the study. If parental SES is causal for children’s intelligence, as claimed by e.g. Eric Turkheimer, then it should also predict intelligence among adopted children. However:
The full results for the adopted and biological child analyses are provided in Supplementary File 1, Table 14. In the model for g, the betas for SES were b = – .05 (S.E.: 0.12) and .36 (S.E.: 0.02) for the adoptive and biological sample, respectively. In the model for brain volume, the betas for SES were b = .01 (S.E.: 0.10) and .11 (S.E.: 0.02) in the adoptive and biological sample, respectively. We reran the adoptive analyses, this time including an interaction term for adoptive status and SES. Adoption status significantly predicted g (t-value = -3.405), but not brain volume. Overall, these adoptive results suggest that the association between SES and g, in this ABCD cohort, may not be mediated by parental environment. This may also be the case for brain volume, but the power is too limited to draw conclusions.
Parental SES completely failed to predict children’s intelligence in the adopted sample, and the difference was far beyond chance. For brain size, the sample was too small to tell.
A long-running line of evidence that Warne highlights is the Jensen method (method of correlated vectors). With this method, you compare the correlations of various intelligence tests with other variables, as well as their g-loadings. On the genetic model, we expect that the tests that measure intelligence better will also be more heritable, show larger correlations with PGSs, show larger group differences, be more correlated with European ancestry, and be more related to brain sizes. In other words, there should be an extended positive manifold. Because the dataset is so rich, a lot of these predictions can be tested:
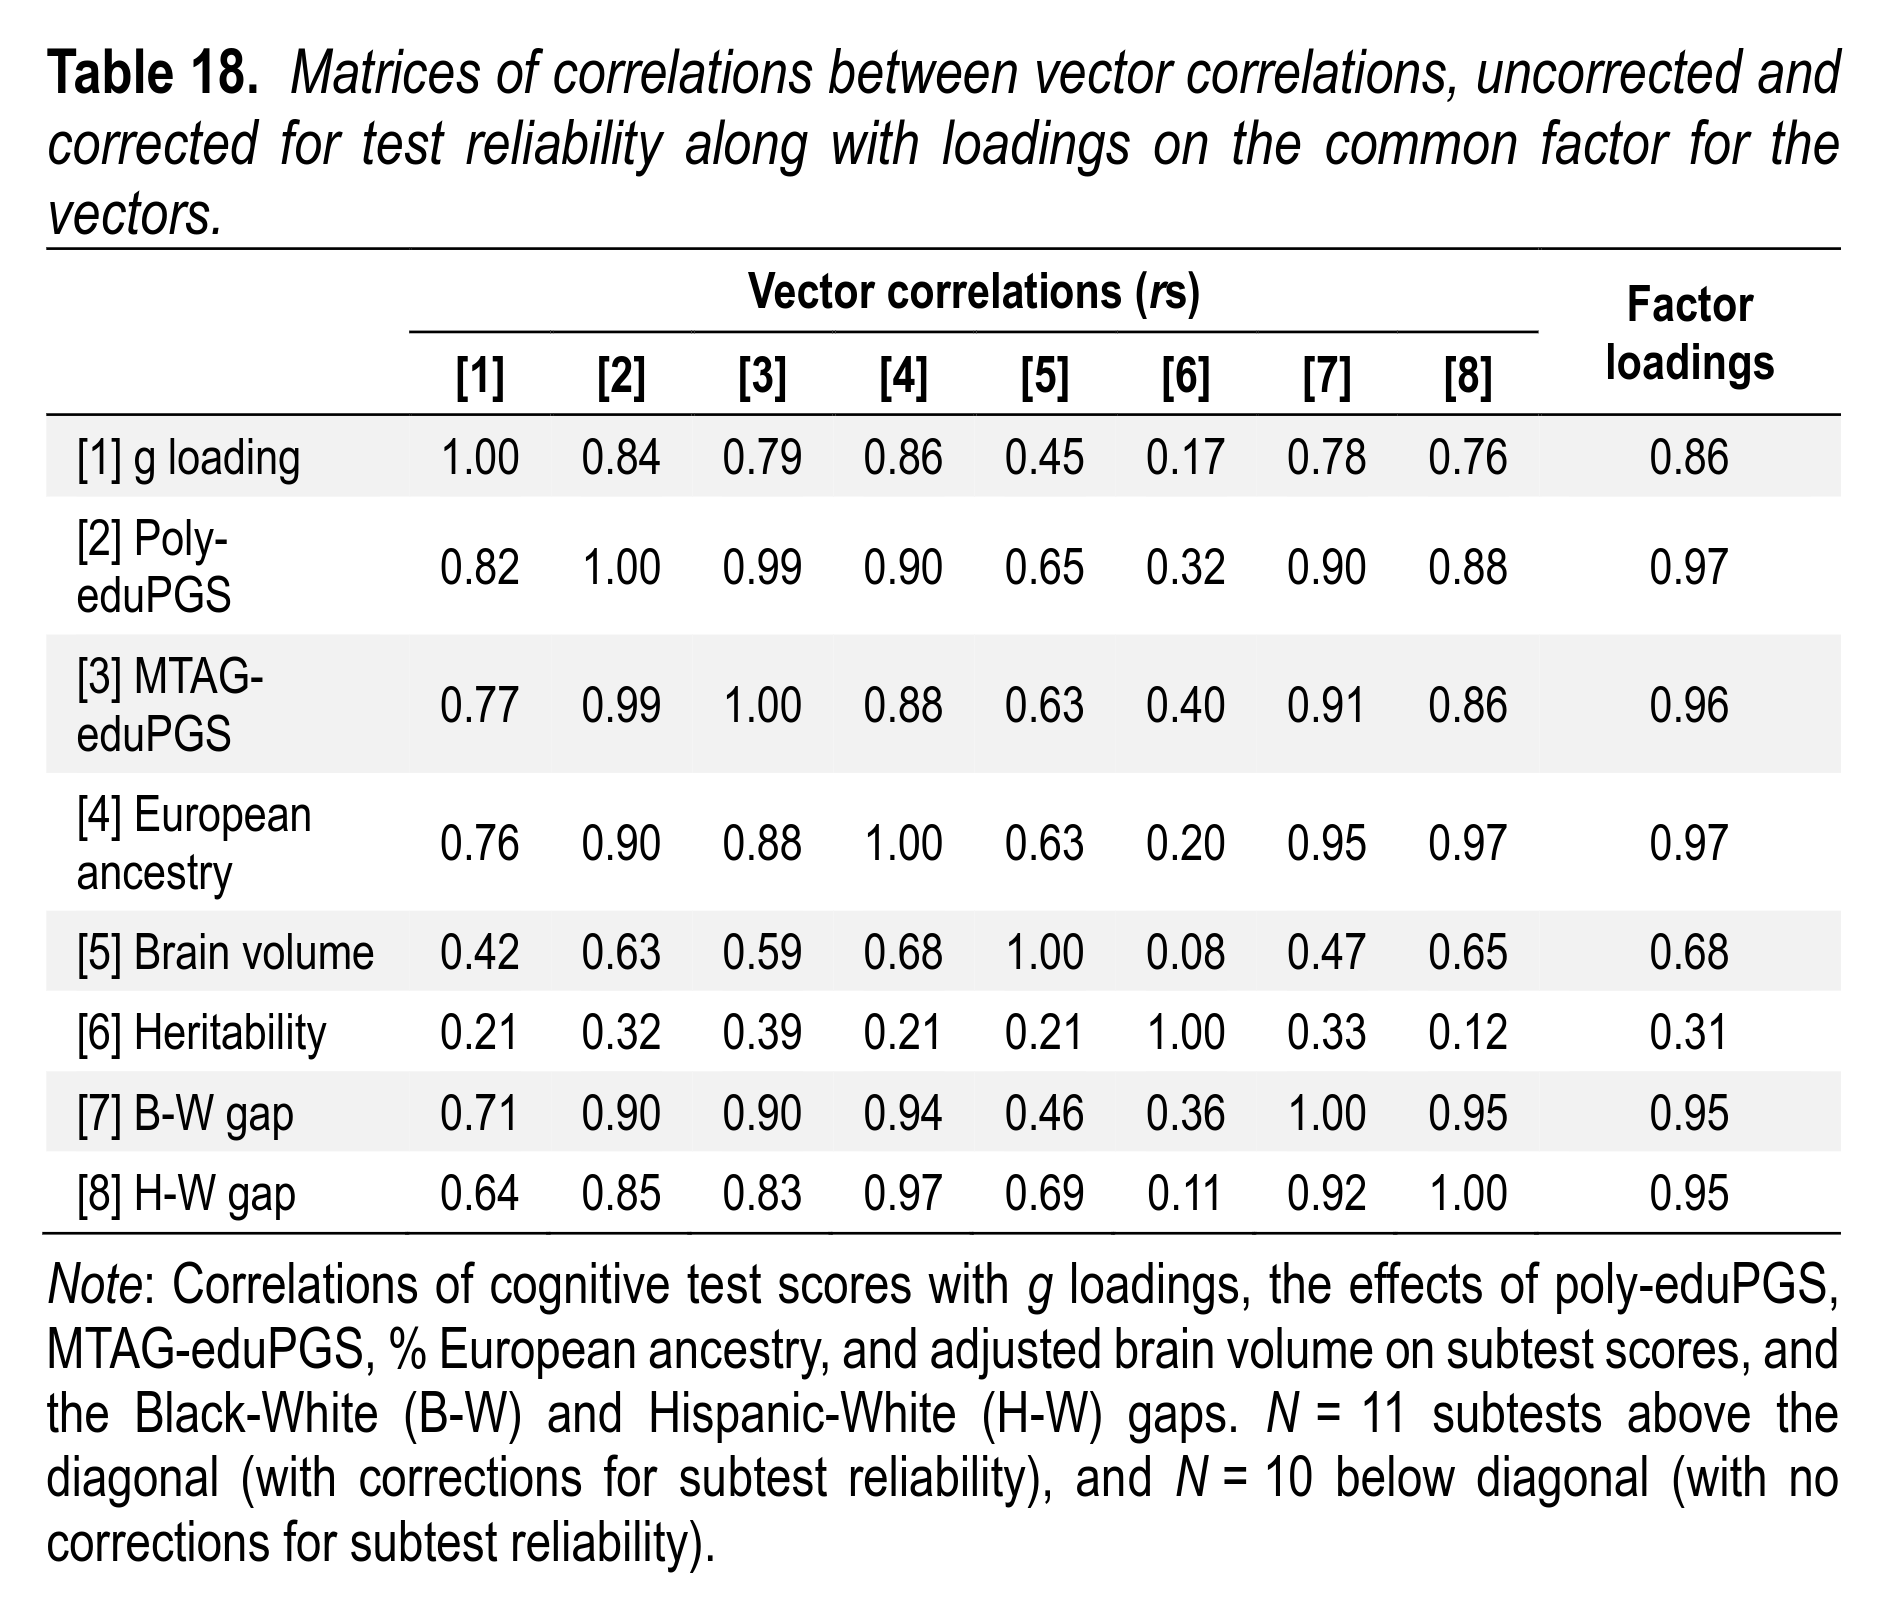
As predicted, the correlations are uniformly positive. The only low correlations are those with heritability. That’s not surprising because the heritability estimates based on twins are very noisy in this dataset. Random error in a variable makes all correlations go towards 0. Theoretically one could adjust for this because the standard error of each heritability estimate is known, and from these, one can estimate the reliability of the vector and adjust for it. We did not attempt this correction, however. (As far as I know, no study has ever done so.) This kind of pattern is difficult to recognize with an environment role for the environment in any of these variables.
Groups and polygenic scores
A particularly cool way of looking at the data is to look at the average intelligence level of groups, and their polygenic scores. This is akin to Piffer’s studies of national IQs, but the difference is that here every subject is a ~10 year old American child taking the same tests. This study then gets around any criticism of national IQs. We used two different groupings: religious groups and ethnic groups.
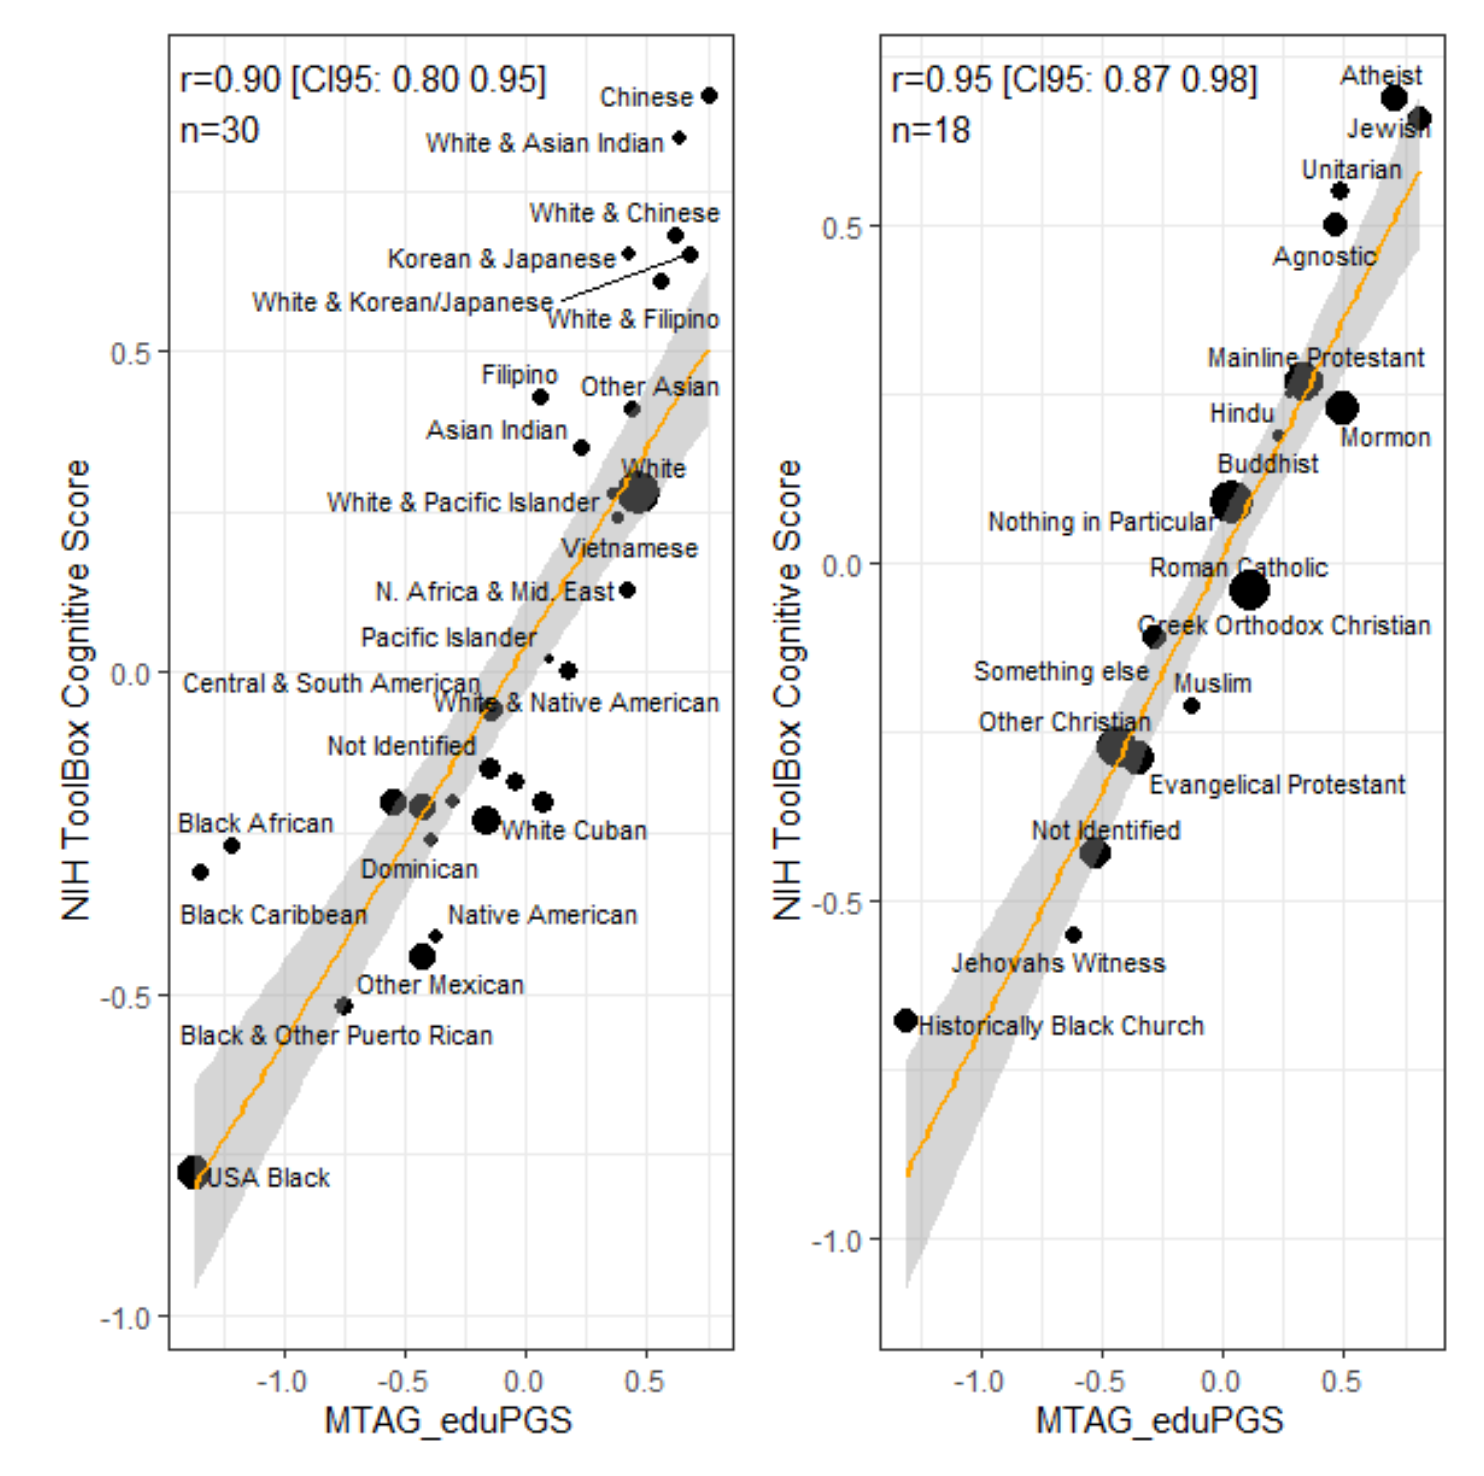
The results were very strong, r’s > .90! These are weighted correlations as the smaller groups provide less certain estimates. There can be some bias in the polygenic scores but it is not enough to throw the results off. For the ethnic groups, we see that Chinese have the highest average intelligence (112) and also almost the highest polygenic score mean. Similarly, for religious groups, the atheists (by mother’s report of religion) had the highest average intelligence (109) and among the highest average polygenic scores, approximately tied with the Jews (IQ 108). For some reason, John didn’t use the IQ norms, so I cannot say exactly what an average of 0.69 z (atheists) corresponds to, but 0 is the total sample size. If we say the total sample mean is 97 and the standard deviation is 17, then we can compute the IQs that I’ve put in the third column. Here’s the table of scores:
| Polygenic score | ||||||||||
| Sample size | NIHTBX (intelligence z score) | Approx IQ | Lee GWAS Lead |
Lee MTAG eduPGS |
Lee MTAG cogPGS |
Lee MTAG mathclass |
Lee MTAG mathability |
Hill MTAG IQPGGS |
Weissbrod Poly eduPGS |
|
| N | mean | mean | mean | mean | mean | mean | mean | mean | mean | |
| Religious groups (mother report of child) |
||||||||||
| Atheist | 249 | 0.69 | 109 | 0.60 | 0.70 | 0.68 | 0.68 | 0.64 | 0.24 | 0.62 |
| Jewish | 223 | 0.66 | 108 | 0.73 | 0.81 | 0.71 | 0.72 | 0.58 | 0.33 | 0.65 |
| Unitarian | 100 | 0.55 | 106 | 0.42 | 0.49 | 0.46 | 0.46 | 0.41 | -0.03 | 0.49 |
| Agnostic | 238 | 0.50 | 106 | 0.47 | 0.47 | 0.45 | 0.45 | 0.41 | 0.26 | 0.47 |
| Mainline Protestant | 1268 | 0.27 | 102 | 0.34 | 0.34 | 0.34 | 0.32 | 0.29 | 0.15 | 0.32 |
| Hindu | 34 | 0.25 | 101 | 0.21 | 0.28 | 0.16 | 0.27 | 0.23 | 0.10 | 0.45 |
| Mormon | 890 | 0.23 | 101 | 0.47 | 0.50 | 0.49 | 0.48 | 0.44 | 0.12 | 0.51 |
| Buddhist | 36 | 0.19 | 100 | 0.15 | 0.23 | 0.25 | 0.25 | 0.26 | 0.41 | 0.09 |
| Nothing in particular | 2452 | 0.09 | 99 | 0.06 | 0.04 | 0.03 | 0.04 | 0.03 | 0.00 | 0.04 |
| Roman Catholic | 2098 | -0.04 | 96 | 0.12 | 0.11 | 0.08 | 0.10 | 0.07 | 0.01 | 0.10 |
| Greek Orthodox Christian | 71 | -0.05 | 96 | 0.09 | 0.13 | 0.10 | 0.13 | 0.13 | -0.13 | 0.06 |
| Something else | 177 | -0.11 | 95 | -0.21 | -0.28 | -0.25 | -0.25 | -0.21 | -0.07 | -0.21 |
| Muslim | 75 | -0.21 | 93 | -0.18 | -0.13 | -0.13 | -0.14 | -0.12 | 0.12 | -0.32 |
| Other Christian | 1952 | -0.27 | 92 | -0.42 | -0.44 | -0.40 | -0.41 | -0.36 | -0.14 | -0.41 |
| Evangelical Protestant | 813 | -0.29 | 92 | -0.38 | -0.35 | -0.32 | -0.33 | -0.28 | -0.07 | -0.32 |
| Not identified | 539 | -0.43 | 90 | -0.53 | -0.53 | -0.49 | -0.49 | -0.42 | -0.19 | -0.50 |
| Jehovahs Witness | 69 | -0.55 | 88 | -0.62 | -0.62 | -0.58 | -0.54 | -0.45 | -0.17 | -0.64 |
| Historically Black Church | 190 | -0.68 | 85 | -1.31 | -1.31 | -1.19 | -1.21 | -1.04 | -0.37 | -1.23 |
| Ethnic groups | ||||||||||
| Chinese | 81 | 0.90 | 112 | 0.62 | 0.75 | 0.57 | 0.77 | 0.67 | 0.49 | 0.15 |
| White & Asian Indian | 44 | 0.83 | 111 | 0.58 | 0.63 | 0.57 | 0.61 | 0.55 | 0.19 | 0.57 |
| White & Chinese | 77 | 0.68 | 109 | 0.67 | 0.62 | 0.50 | 0.61 | 0.54 | 0.23 | 0.46 |
| Korean & Japanese | 33 | 0.65 | 108 | 0.39 | 0.43 | 0.35 | 0.49 | 0.50 | 0.52 | 0.13 |
| White & Korean/Japanese | 78 | 0.65 | 108 | 0.65 | 0.67 | 0.63 | 0.68 | 0.63 | 0.64 | 0.42 |
| White & Filipino | 60 | 0.61 | 107 | 0.58 | 0.56 | 0.46 | 0.54 | 0.48 | 0.24 | 0.13 |
| Filipino | 51 | 0.43 | 104 | 0.19 | 0.06 | -0.13 | 0.02 | -0.10 | 0.30 | -0.28 |
| Other Asian | 52 | 0.41 | 104 | 0.40 | 0.44 | 0.34 | 0.41 | 0.31 | 0.32 | 0.34 |
| Asian Indian | 53 | 0.35 | 103 | 0.25 | 0.23 | 0.11 | 0.21 | 0.17 | 0.20 | 0.48 |
| White | 5858 | 0.28 | 102 | 0.49 | 0.47 | 0.45 | 0.44 | 0.39 | 0.13 | 0.48 |
| White & Pacific Islander | 25 | 0.28 | 102 | 0.46 | 0.36 | 0.21 | 0.28 | 0.14 | 0.09 | 0.27 |
| Vietnamese | 24 | 0.24 | 101 | 0.28 | 0.38 | 0.28 | 0.41 | 0.37 | 0.63 | -0.30 |
| N. Africa & Mid. East | 47 | 0.13 | 99 | 0.33 | 0.42 | 0.38 | 0.40 | 0.37 | 0.18 | 0.20 |
| Pacific Islander | 17 | 0.02 | 97 | 0.10 | 0.10 | -0.03 | 0.13 | 0.12 | -0.15 | 0.00 |
| White & Native American | 144 | 0.00 | 97 | 0.23 | 0.18 | 0.18 | 0.17 | 0.15 | -0.02 | 0.25 |
| Central & South American | 352 | -0.06 | 96 | -0.14 | -0.14 | -0.20 | -0.15 | -0.17 | 0.02 | -0.13 |
| Not Identified | 217 | -0.15 | 94 | -0.11 | -0.15 | -0.14 | -0.13 | -0.10 | -0.11 | -0.17 |
| White Puerto Rican | 133 | -0.17 | 94 | 0.03 | -0.04 | -0.08 | -0.08 | -0.13 | -0.09 | -0.18 |
| NH Black & White | 418 | -0.20 | 94 | -0.58 | -0.55 | -0.50 | -0.50 | -0.42 | -0.18 | -0.54 |
| Other Cuban | 30 | -0.20 | 94 | -0.43 | -0.30 | -0.27 | -0.23 | -0.16 | -0.21 | -0.53 |
| White Cuban | 151 | -0.20 | 94 | 0.15 | 0.07 | 0.03 | 0.02 | -0.03 | 0.03 | 0.07 |
| Other Hispanic | 518 | -0.21 | 93 | -0.46 | -0.43 | -0.42 | -0.40 | -0.36 | -0.11 | -0.44 |
| White Mexican | 775 | -0.23 | 93 | -0.15 | -0.16 | -0.22 | -0.17 | -0.20 | -0.09 | -0.14 |
| Dominican | 38 | -0.26 | 93 | -0.41 | -0.39 | -0.38 | -0.39 | -0.37 | -0.01 | -0.32 |
| Black African | 59 | -0.27 | 92 | -1.27 | -1.22 | -1.08 | -1.11 | -0.92 | -0.31 | -1.30 |
| Black Caribbean | 51 | -0.31 | 92 | -1.35 | -1.35 | -1.17 | -1.20 | -0.96 | -0.31 | -1.25 |
| Native American | 39 | -0.41 | 90 | -0.36 | -0.37 | -0.36 | -0.32 | -0.26 | -0.03 | -0.37 |
| Other Mexican | 460 | -0.44 | 90 | -0.44 | -0.43 | -0.50 | -0.43 | -0.45 | -0.16 | -0.39 |
| Black & other Puerto Rican | 90 | -0.52 | 88 | -0.73 | -0.75 | -0.74 | -0.75 | -0.72 | -0.32 | -0.62 |
| USA Black | 1499 | -0.78 | 84 | -1.41 | -1.37 | -1.22 | -1.25 | -1.04 | -0.38 | -1.33 |
Overall, the results reveal no big surprises. For those wondering why (Asian) Indians are so low, it’s because these are the 10 year old children of immigrants. Since India itself has a population mean of 80-85 IQ, we expect the children of the very selected Indians in America to regress quite a bit towards their mean. In this case, the sample of 52 Indian obtained a score of 103. I imagine the parent generation will be 115 IQ or so.
Conclusions
Another set of high-powered tests of hereditarian predictions produced consistent results, whether looking at genetic ancestry, brain size, a machine learning model of brain functioning, measurement invariance (MGCFA, LSEM), Jensen’s method, polygenic scores, group differences, and twin results. Everything fits more or less, while nothing fits with the egalitarian alternative hypothesis. Egalitarian researchers need to put up new contrary results or give up.