By coincidence I found this paper the other day:
- Sturgis, P., Brunton-Smith, I., Allum, N., & Fuglsang, S. (2024). Testing the cultural-invariance hypothesis: A global analysis of the relationship between scientific knowledge and attitudes to science. Plos one, 19(2), e0296860.
A substantial body of research has demonstrated that science knowledge is correlated with attitudes towards science, with most studies finding a positive relationship between the two constructs; people who are more knowledgeable about science tend to be more positive about it. However, this evidence base has been almost exclusively confined to high and middle-income democracies, with poorer and less developed nations excluded from consideration. In this study, we conduct the first global investigation of the science knowledge-attitude relationship, using the 2018 Wellcome Global Monitor survey. Our results show a positive knowledge-attitude correlation in all but one of the 144 countries investigated. This robust cross-national relationship is consistent across both science literacy and self-assessed measures of science knowledge.
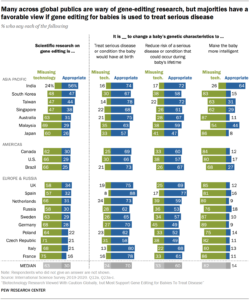
The study itself is not that interesting since it is about examining the between-country variation in the relationship between attitudes to science and science knowledge. However, they do present this plot:
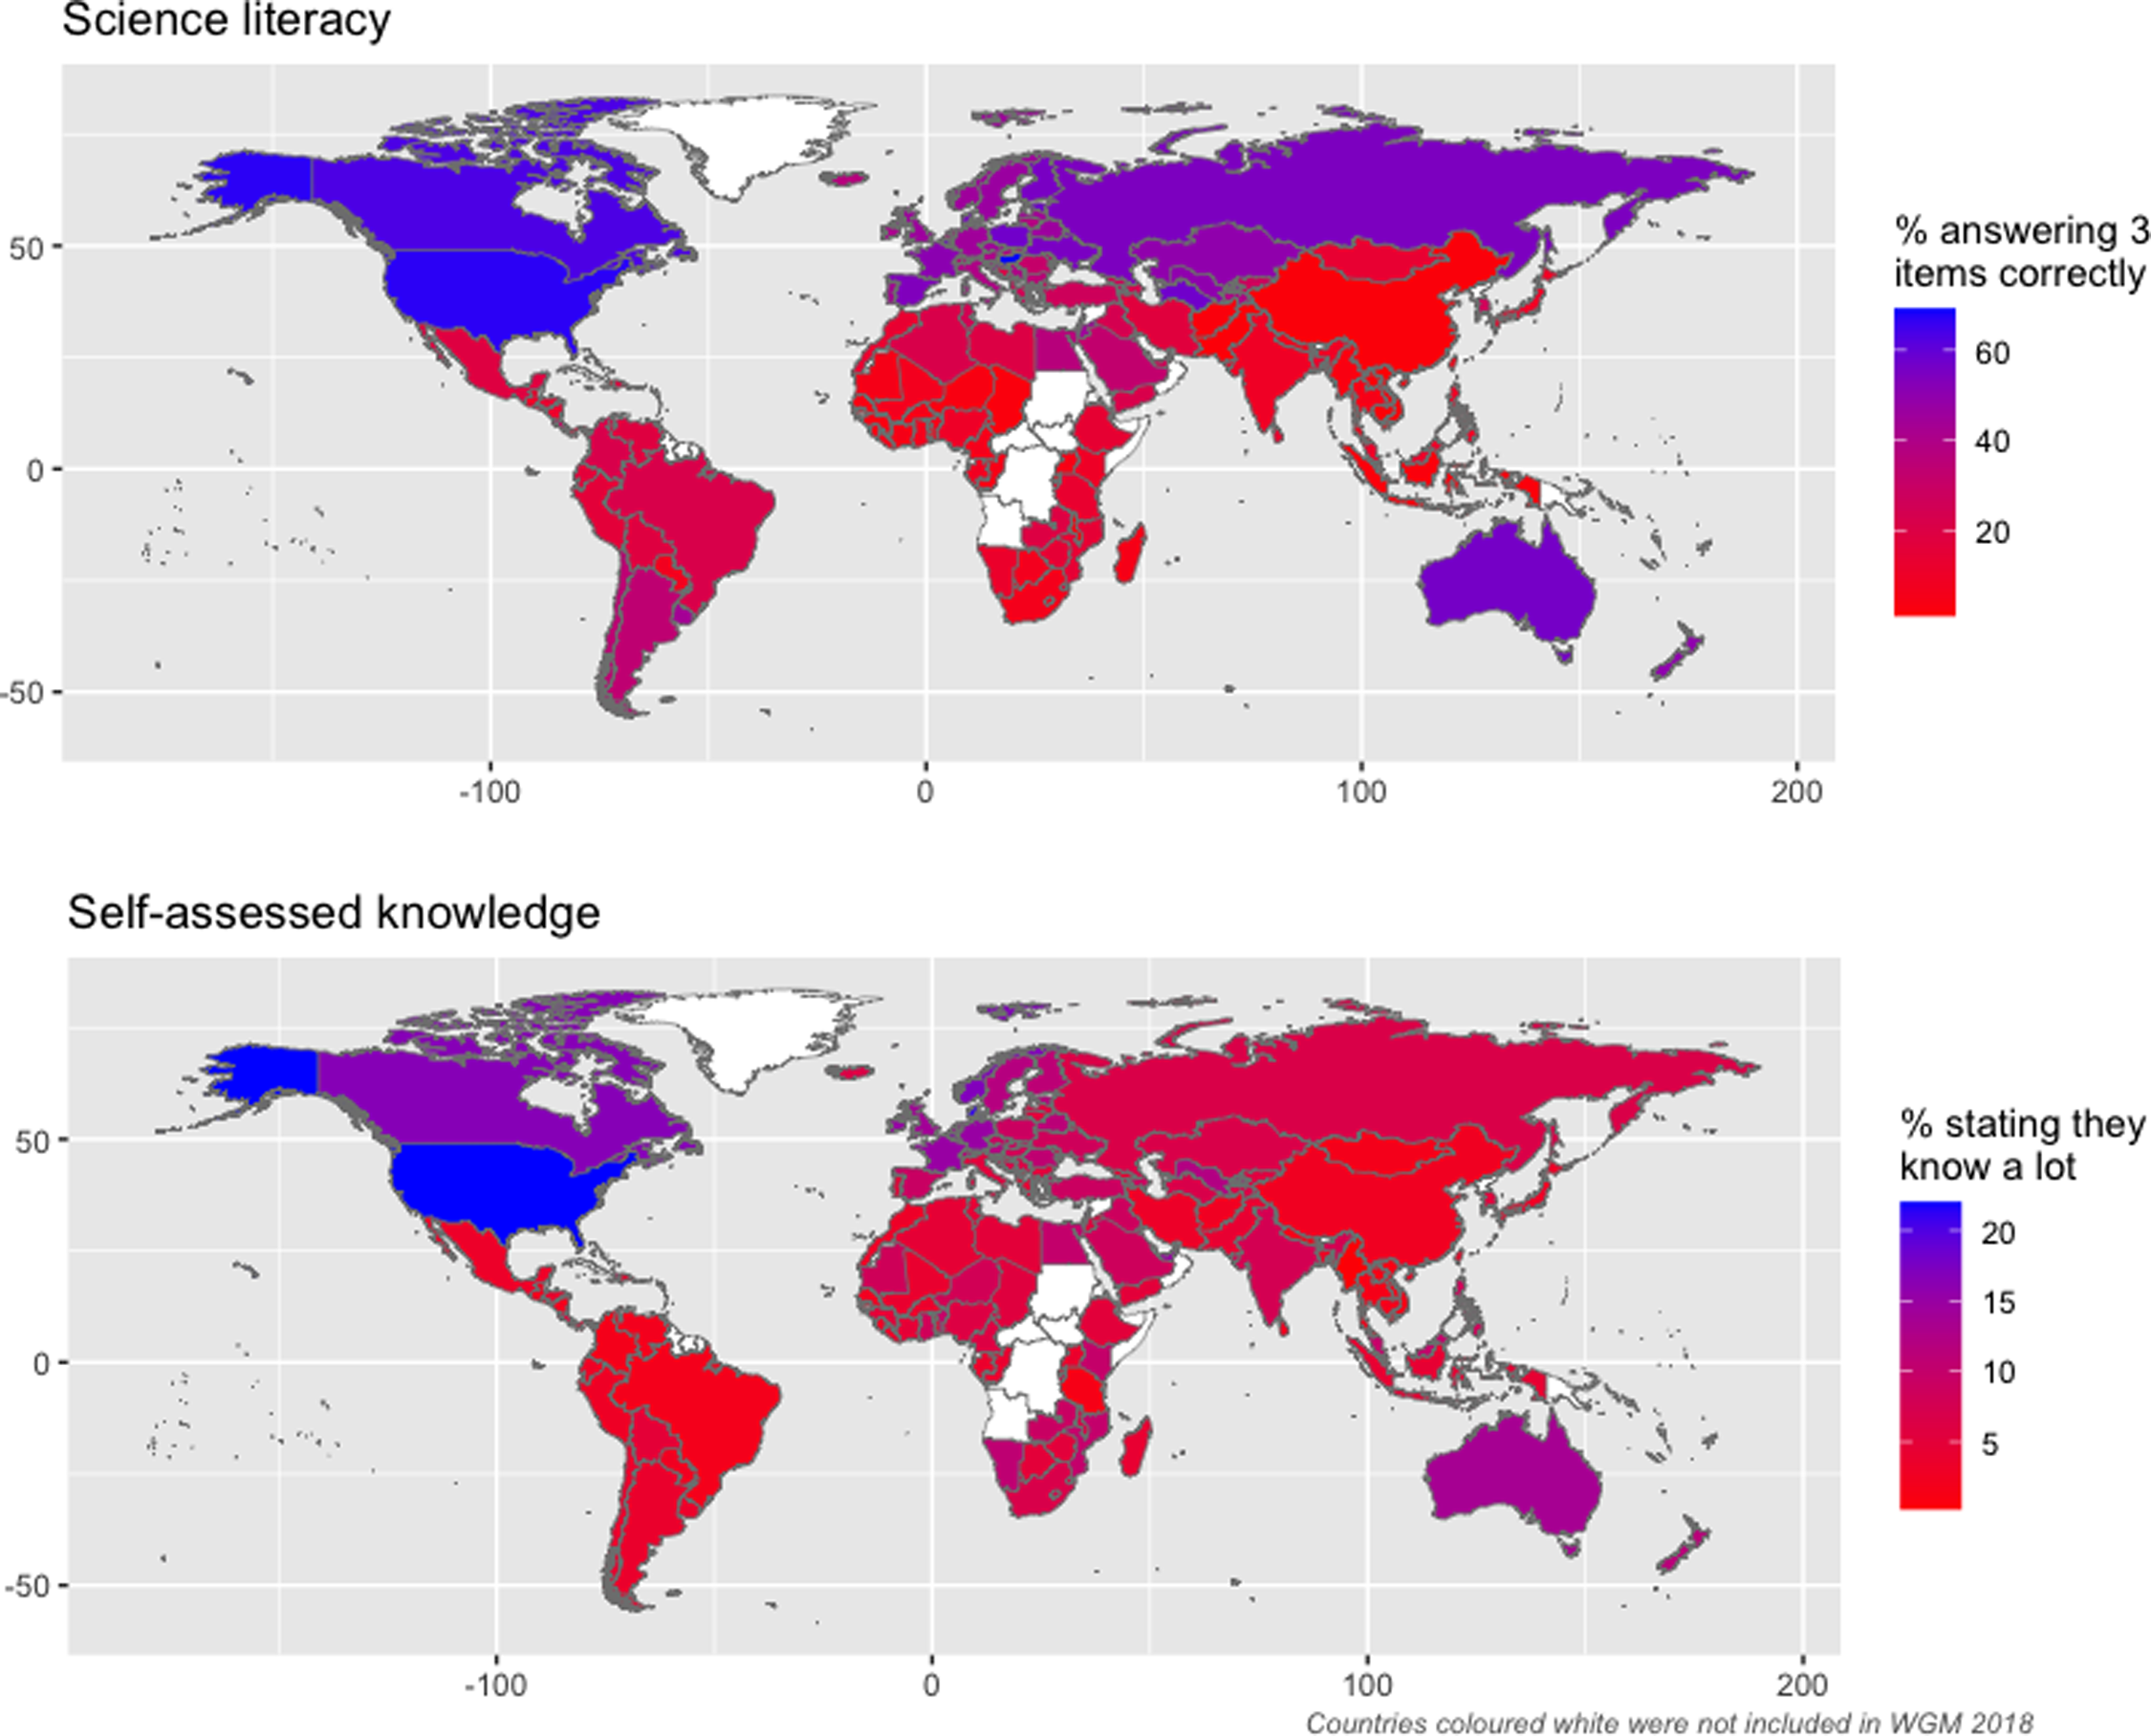
The top map shows a crude measure of science knowledge by country. And I really do mean crude:
The science literacy measure is derived from three items which tap, directly or indirectly, the respondent’s understanding of scientific concepts. It is taken as the predicted score from a 2-parameter Item Response Theory (IRT) model from the following three items (correct answers indicated (1) incorrect (0)):
- In this survey, when I say ‘science’ I mean the understanding we have about the world from observation and testing. When I say ‘scientists’ I mean people who study the Planet Earth, nature and medicine, among other things. How much did you understand the meaning of ‘science’ and ‘scientists’ that was just read? A lot (1), Some (0), not much (0), not at all (0)
- Do you think studying diseases is a part of science? Yes (1), No (0)
- Do you think studying diseases is a part of science? Yes (0), No (1) [not included by authors, but I added it here for completion]
- A vaccine is given to people to strengthen their body’s ability to fight certain diseases. Sometimes people are given a vaccine as [insert country equivalent term for a shot or an injection], but vaccines can also be given by mouth or some other way. Before today, had you ever heard of a vaccine? Yes (1), No (0)
We considered a fourth item which asked ‘do you think poetry is a part of science? (Yes(1), No(0) but the IRT model indicated that this did not scale with the other three items. These items were not designed with the intention of measuring science literacy and the scale is sub-optimal in both content coverage and specificity. We return to a consideration of the implications of these limitations in the discussion section.
If you thought the OKCupid intelligence test was bad (14 items), then the above must be absolutely terrible. How can it be taken seriously? The answer lies in statistics. A test with very low reliability measures the intended construct not very well. That is, the correlation between a perfect measure of your construct and what the test measures is weak. This means that trying to use data from individuals in a regression model, say, will yield biased results, all in all underestimating the relationship between the thing you are trying to measure and everything else.
However, things are different at the group level. Here we don’t care about estimating each person’s standing on some trait, we simply wish to know the average trait level of the group (this insight is the same that Greg Clark’s surname analysis relies upon). Here the reliability of a test at the individual level has actually little consequence if your sample size is half decent. And the sample sizes for this study is awesome:
We use data from the 2018 Wellcome Global Monitor, a cross-national survey of adults aged 15+ living in households at non-institutional addresses. The achieved sample size was approximately 1,000 in each of the 144 countries, rising to 2,000 for China, India, and Russia, resulting in a total sample of 149,014 individuals. In countries with at least 80% phone coverage, interviews were carried out via Computer Assisted Telephone Interviewing (CATI), with face-to-face interviewing used in the remaining countries. For telephone interviews, sampling was implemented through either Random Digit Dialling (RDD) or simple random sampling from nationally representative lists of numbers. Dual frame sampling was used in countries with high rates of mobile phone penetration. Sampling for in-home interviews was implemented in 2-stages, where the first stage selected primary sampling units (PSU) with probability proportional to population size and the second stage selected a random sample of households within each PSU, using the random route method. The source questionnaire was produced in English, Spanish, and French and then translated using local translators into every language spoken by more than 5% of the resident population in each country using back translation. Further details about the methodology of the GWP can be found in the survey technical report (https://cms.wellcome.org/sites/default/files/wgm2018-methodology.pdf).
The main worry with using such a poor test is that the error component might not be random. That is, in test theory, your test is supposed to measure the trait of interest plus random noise (proportional to its reliability). However, if you use suboptimal questions like the above, maybe the remaining variation in the scores will not be random noise, but trait variance from other traits. In other words, though you brand your test as a science knowledge test, it is really measuring science knowledge only in part, and in part other things. This might be a big problem.
I was curious, so I checked, and the dataset the authors used is public. You can download it here to play around (Appendix D). In order to find more items from other years, I looked at the follow-up 2020 survey, but it didn’t have any knowledge questions (well, it had the same self-rate one as above but nothing else). There doesn’t appear to be a 2016 or 2022 report, so this is all we have to work with.
Given the authors’ comments above concerning the poetry question, I decided to check myself. Here’s the item response theory results for including or excluding the poetry question:

So the authors were right, the poetry item has a terrible factor loading of only 0.14 (it correlates with the underlying variable at 0.14). This arises because of the weak correlations with the other items:
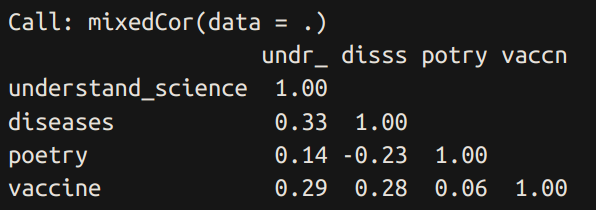
I would guess this has something to do with survey biases, specifically, acquiescence bias. This is the tendency of people to answer affirmative to questions, resulting in spuriously high correlations between positively phrased questions, and negative correlations between questions of opposite phrasing. The poetry question is the only question where answering “no” is correct.
Still, according to the reliability coefficients, the model is actually better when including the poetry question, as the reliability with it is 0.55 versus 0.38 without it. The reason for this is mainly that the “understand science” item has a larger loading in the first model (0.82 vs. 0.61). Anyway, I decided to compare the results to see. It turns out it doesn’t matter:
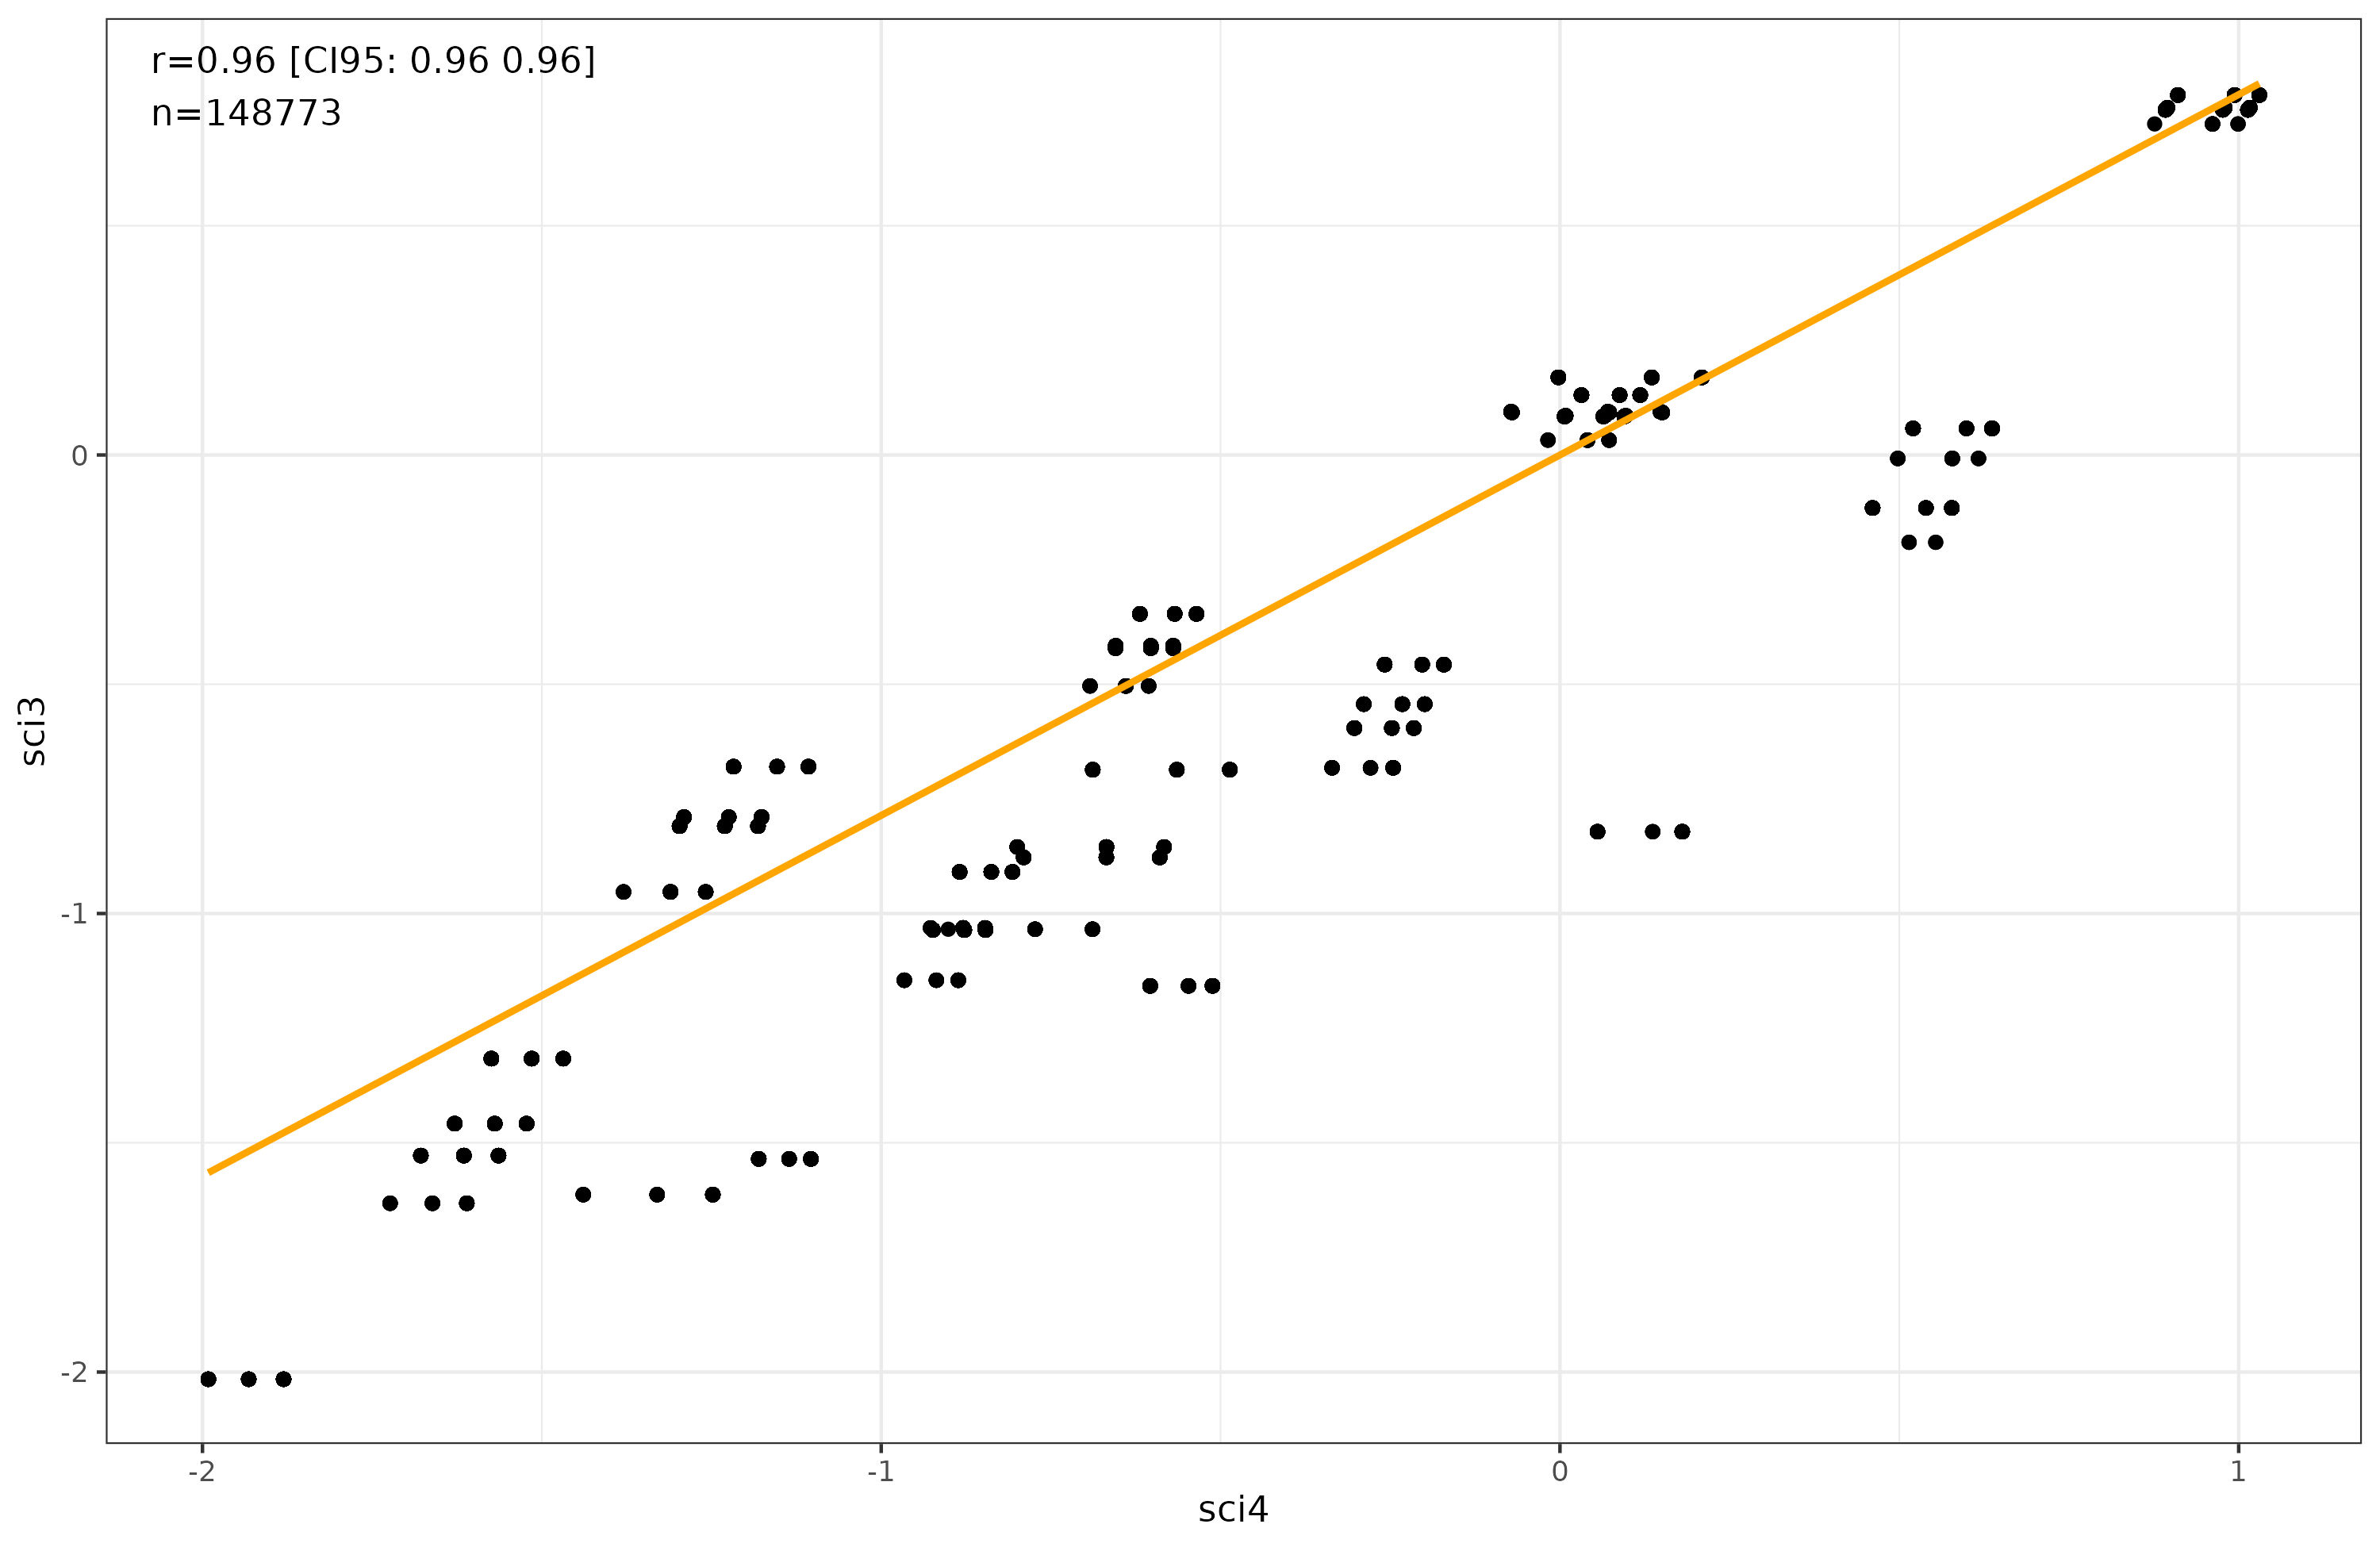
These are person-level results. The strange looking clusters arise from the fact that given 3 or 4 items, there are only a few possible scores one can get.
Going to the country level involves simply taking the average inside each of the 144 countries, which gives us this plot:
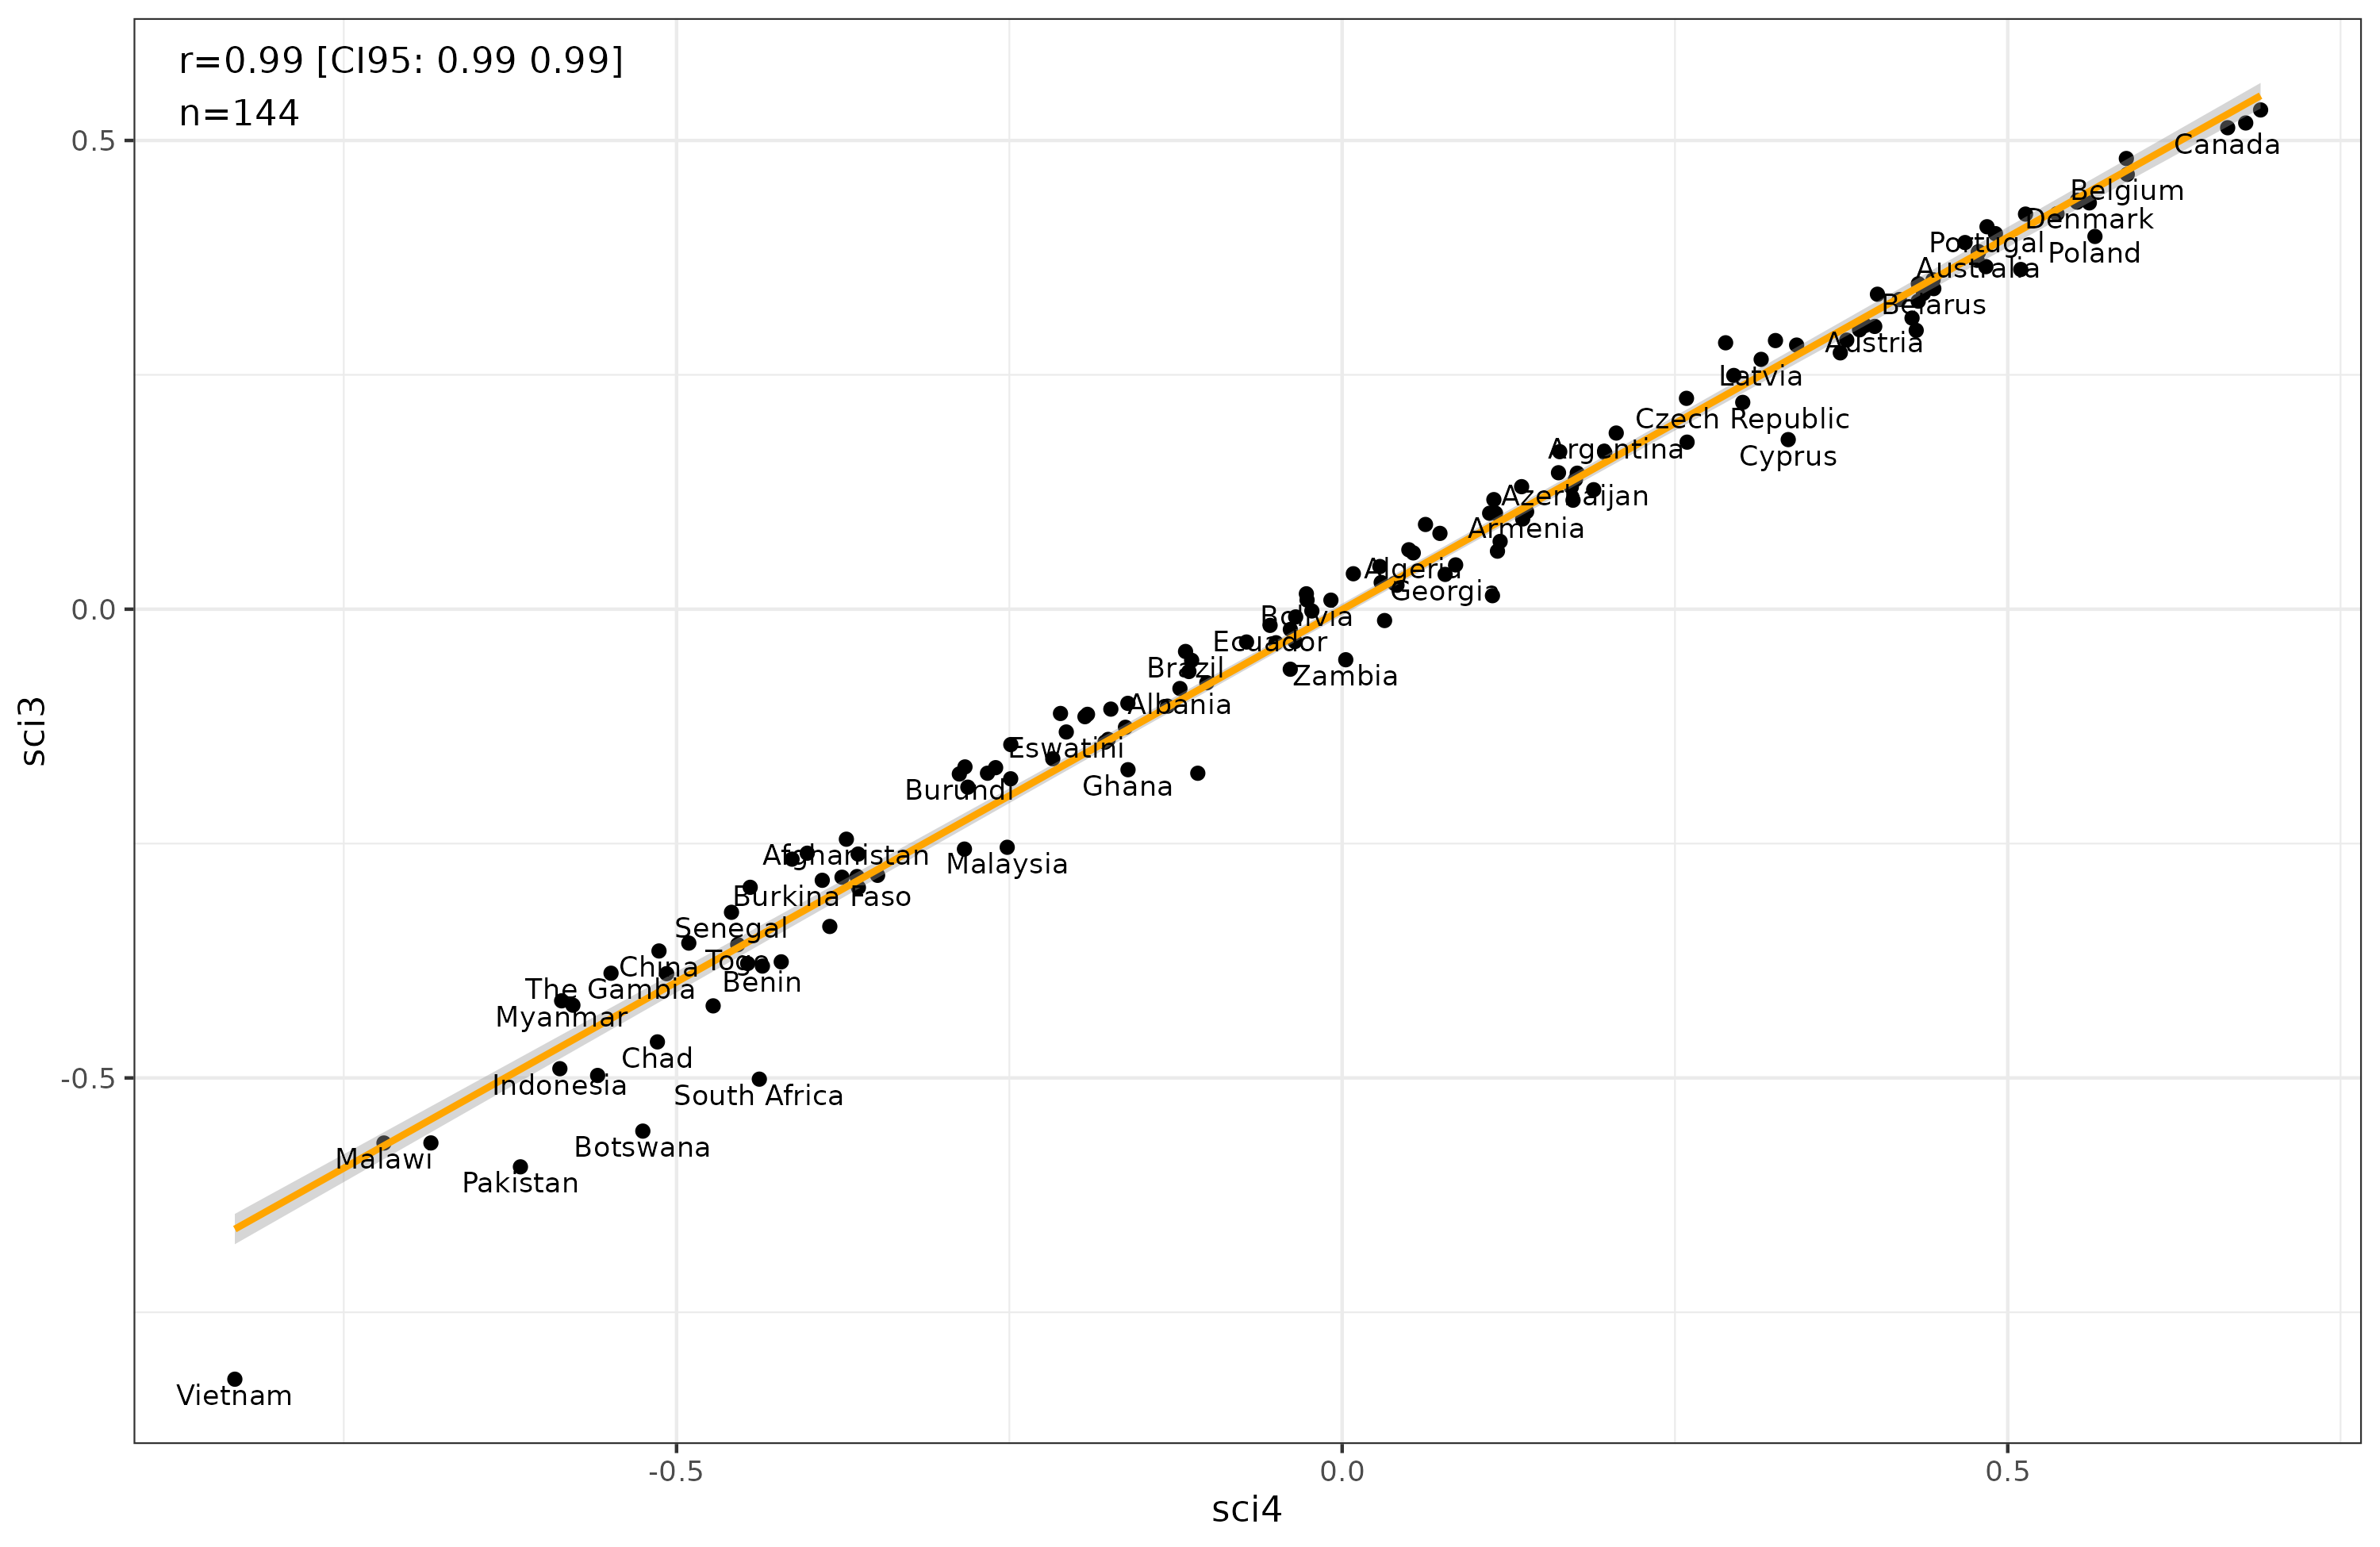
So again it doesn’t matter whether we use the poetry item or not.
Finally, let’s compare this new science knowledge country-level score with the usual national IQ results. Here I am using my previously published compilation of NIQ estimates from 6 datasets:
- Lynn 2012. Still the most comprehensive, includes both IQ tests and scholastic tests.
- Rindermann 2018. Only includes scholastic tests with various corrections for sampling biases.
- Becker 2019. Includes some IQ tests and scholastic tests.
- Lim 2018. Another Lynn copycat, published in The Lancet of all places.
- Woessman 2022. National basic skills.
- Altinok & Diebolt 2023. Learning outcomes.
You can look at the data here. Here’s the main results:
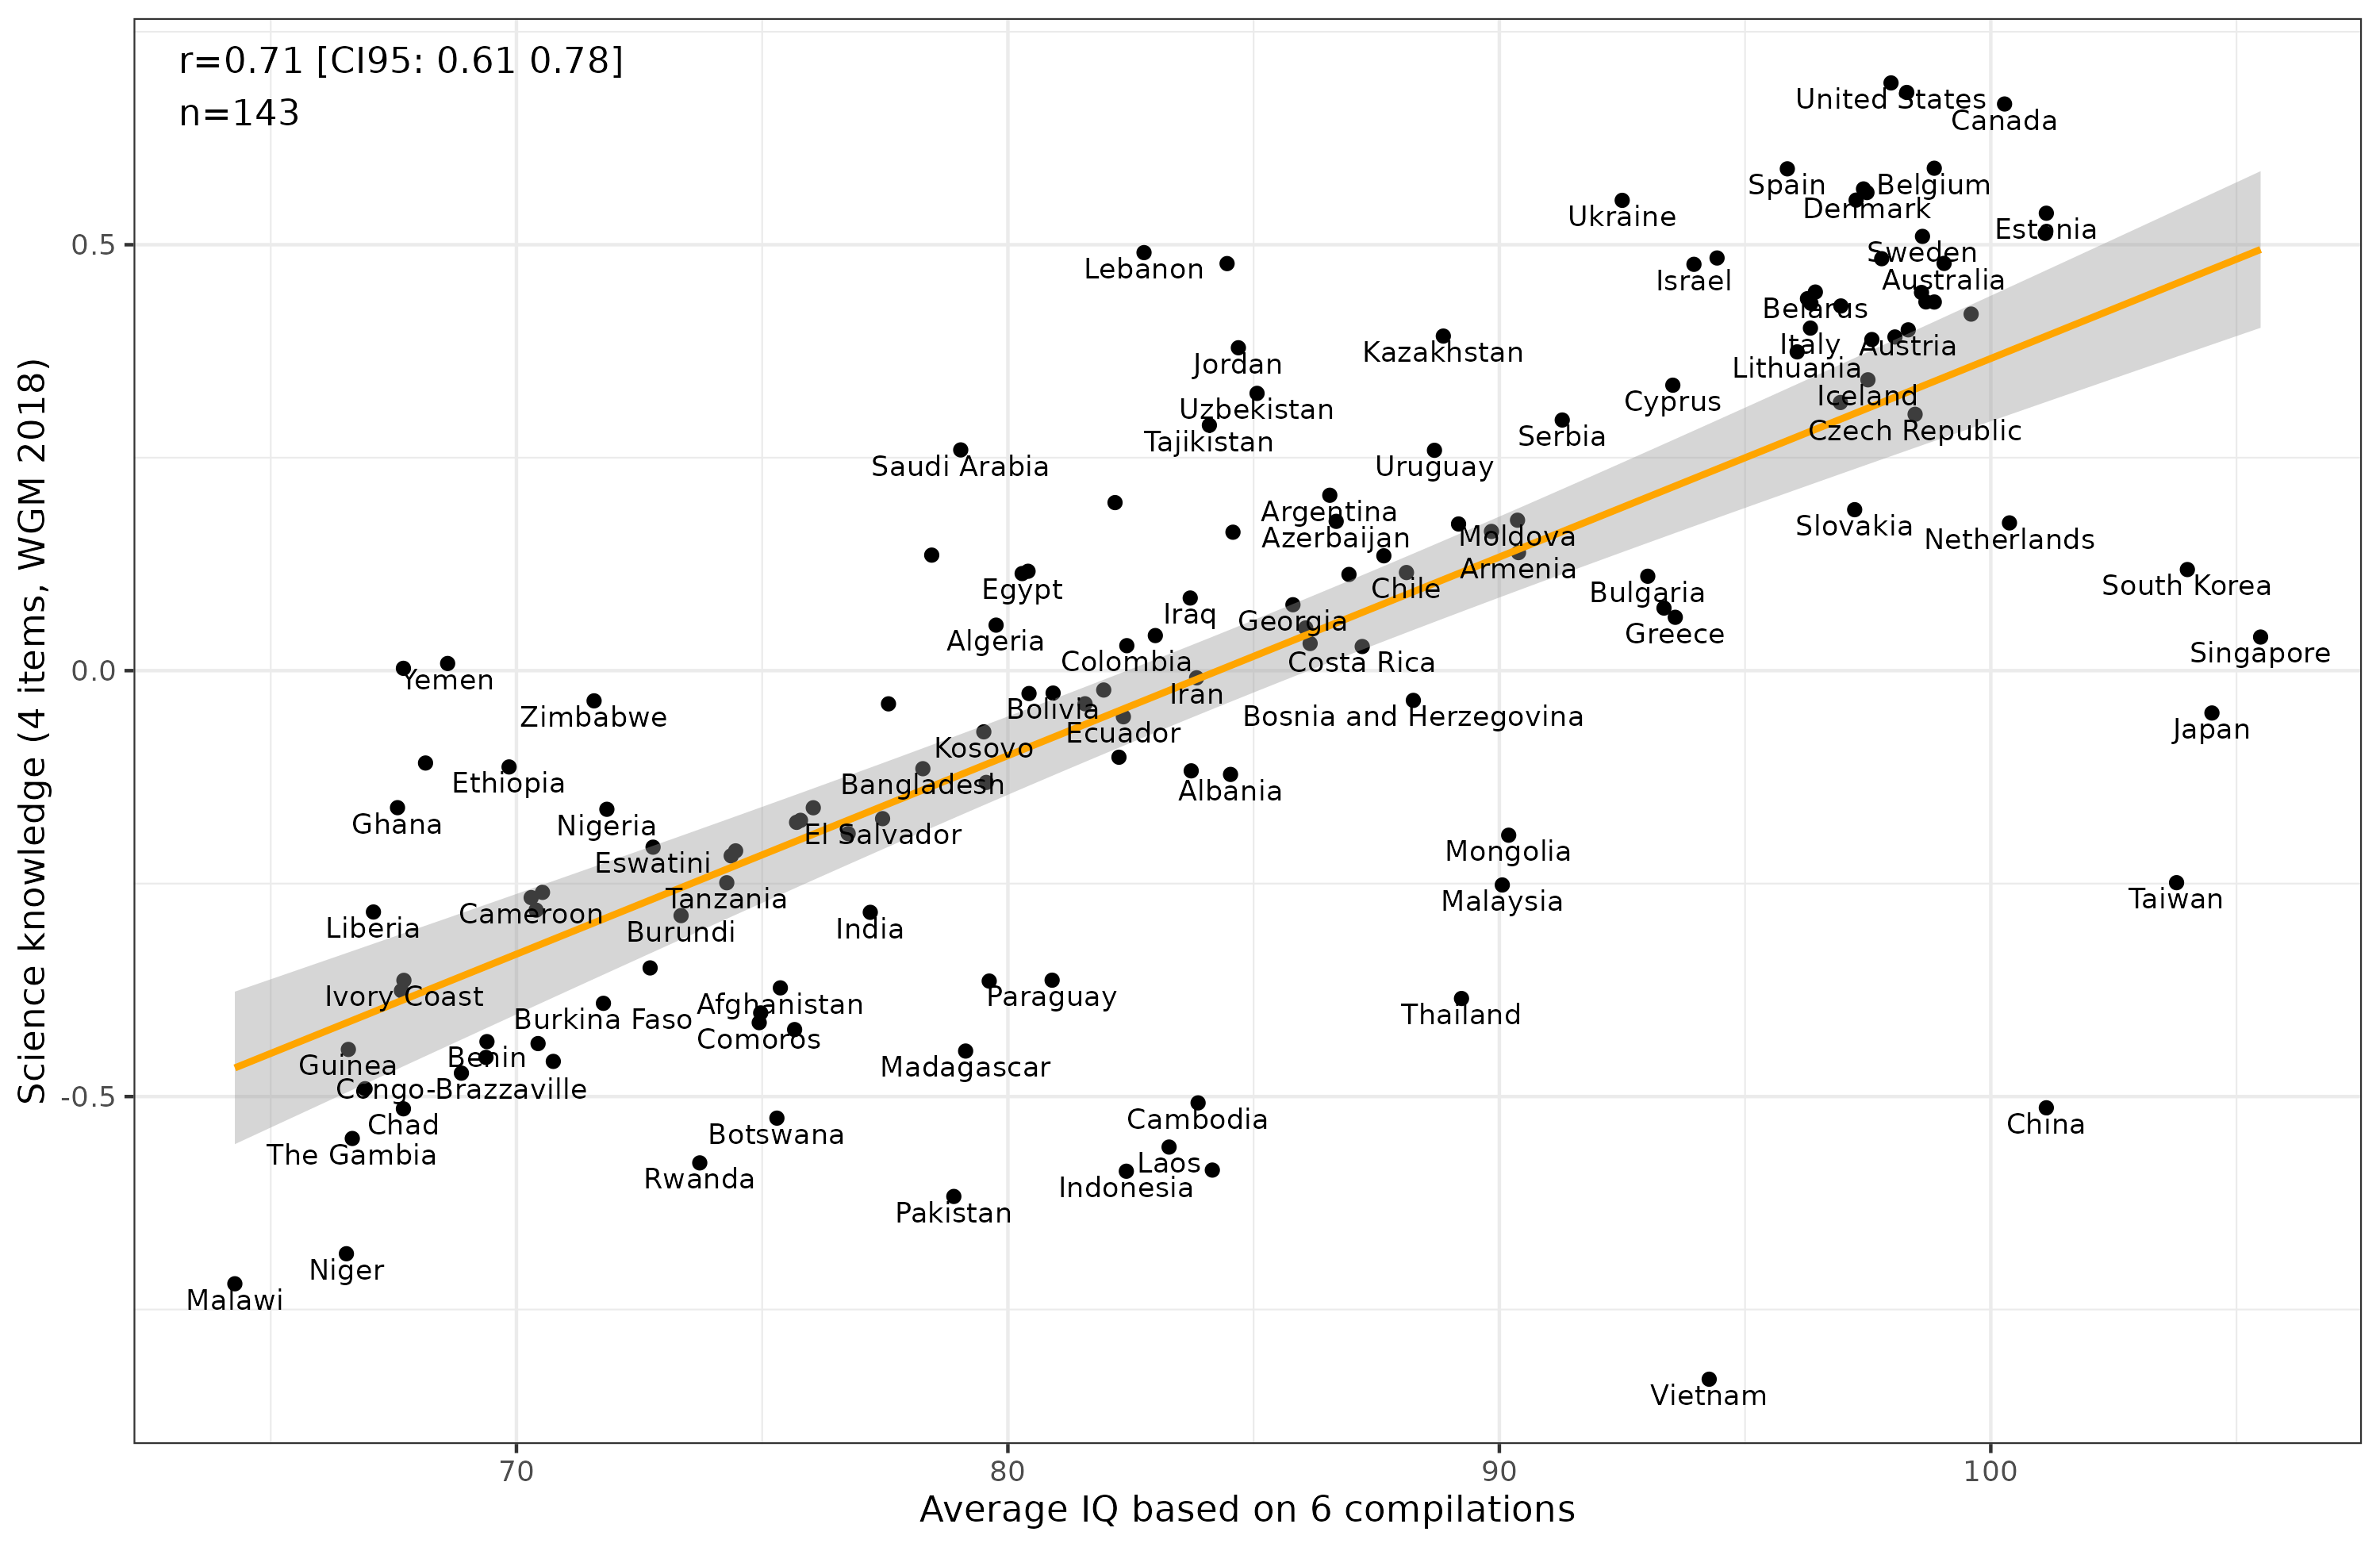
The results are in the right direction and half-decent (r = 0.71), but the Asians have taken a massive hit. We can get an idea of why that is if we plot the results by item:

The Asian issue is from the “understand science” item. Recall that this question asks people how much they understand from what they have just read, or been read. This taps into another trait, namely, humility. What the results really show, then, is that Asians are more humble than others, and since this biased item is used for ranking countries, Asian countries get erroneously low estimates compared to their true score (actual level of science knowledge). This is an excellent example of test bias, as this item measures two traits at once, the other of which shows a large difference unrelated to the trait of interest.
We can try the alternative 3 item model without the “understand science” item and see how that looks:
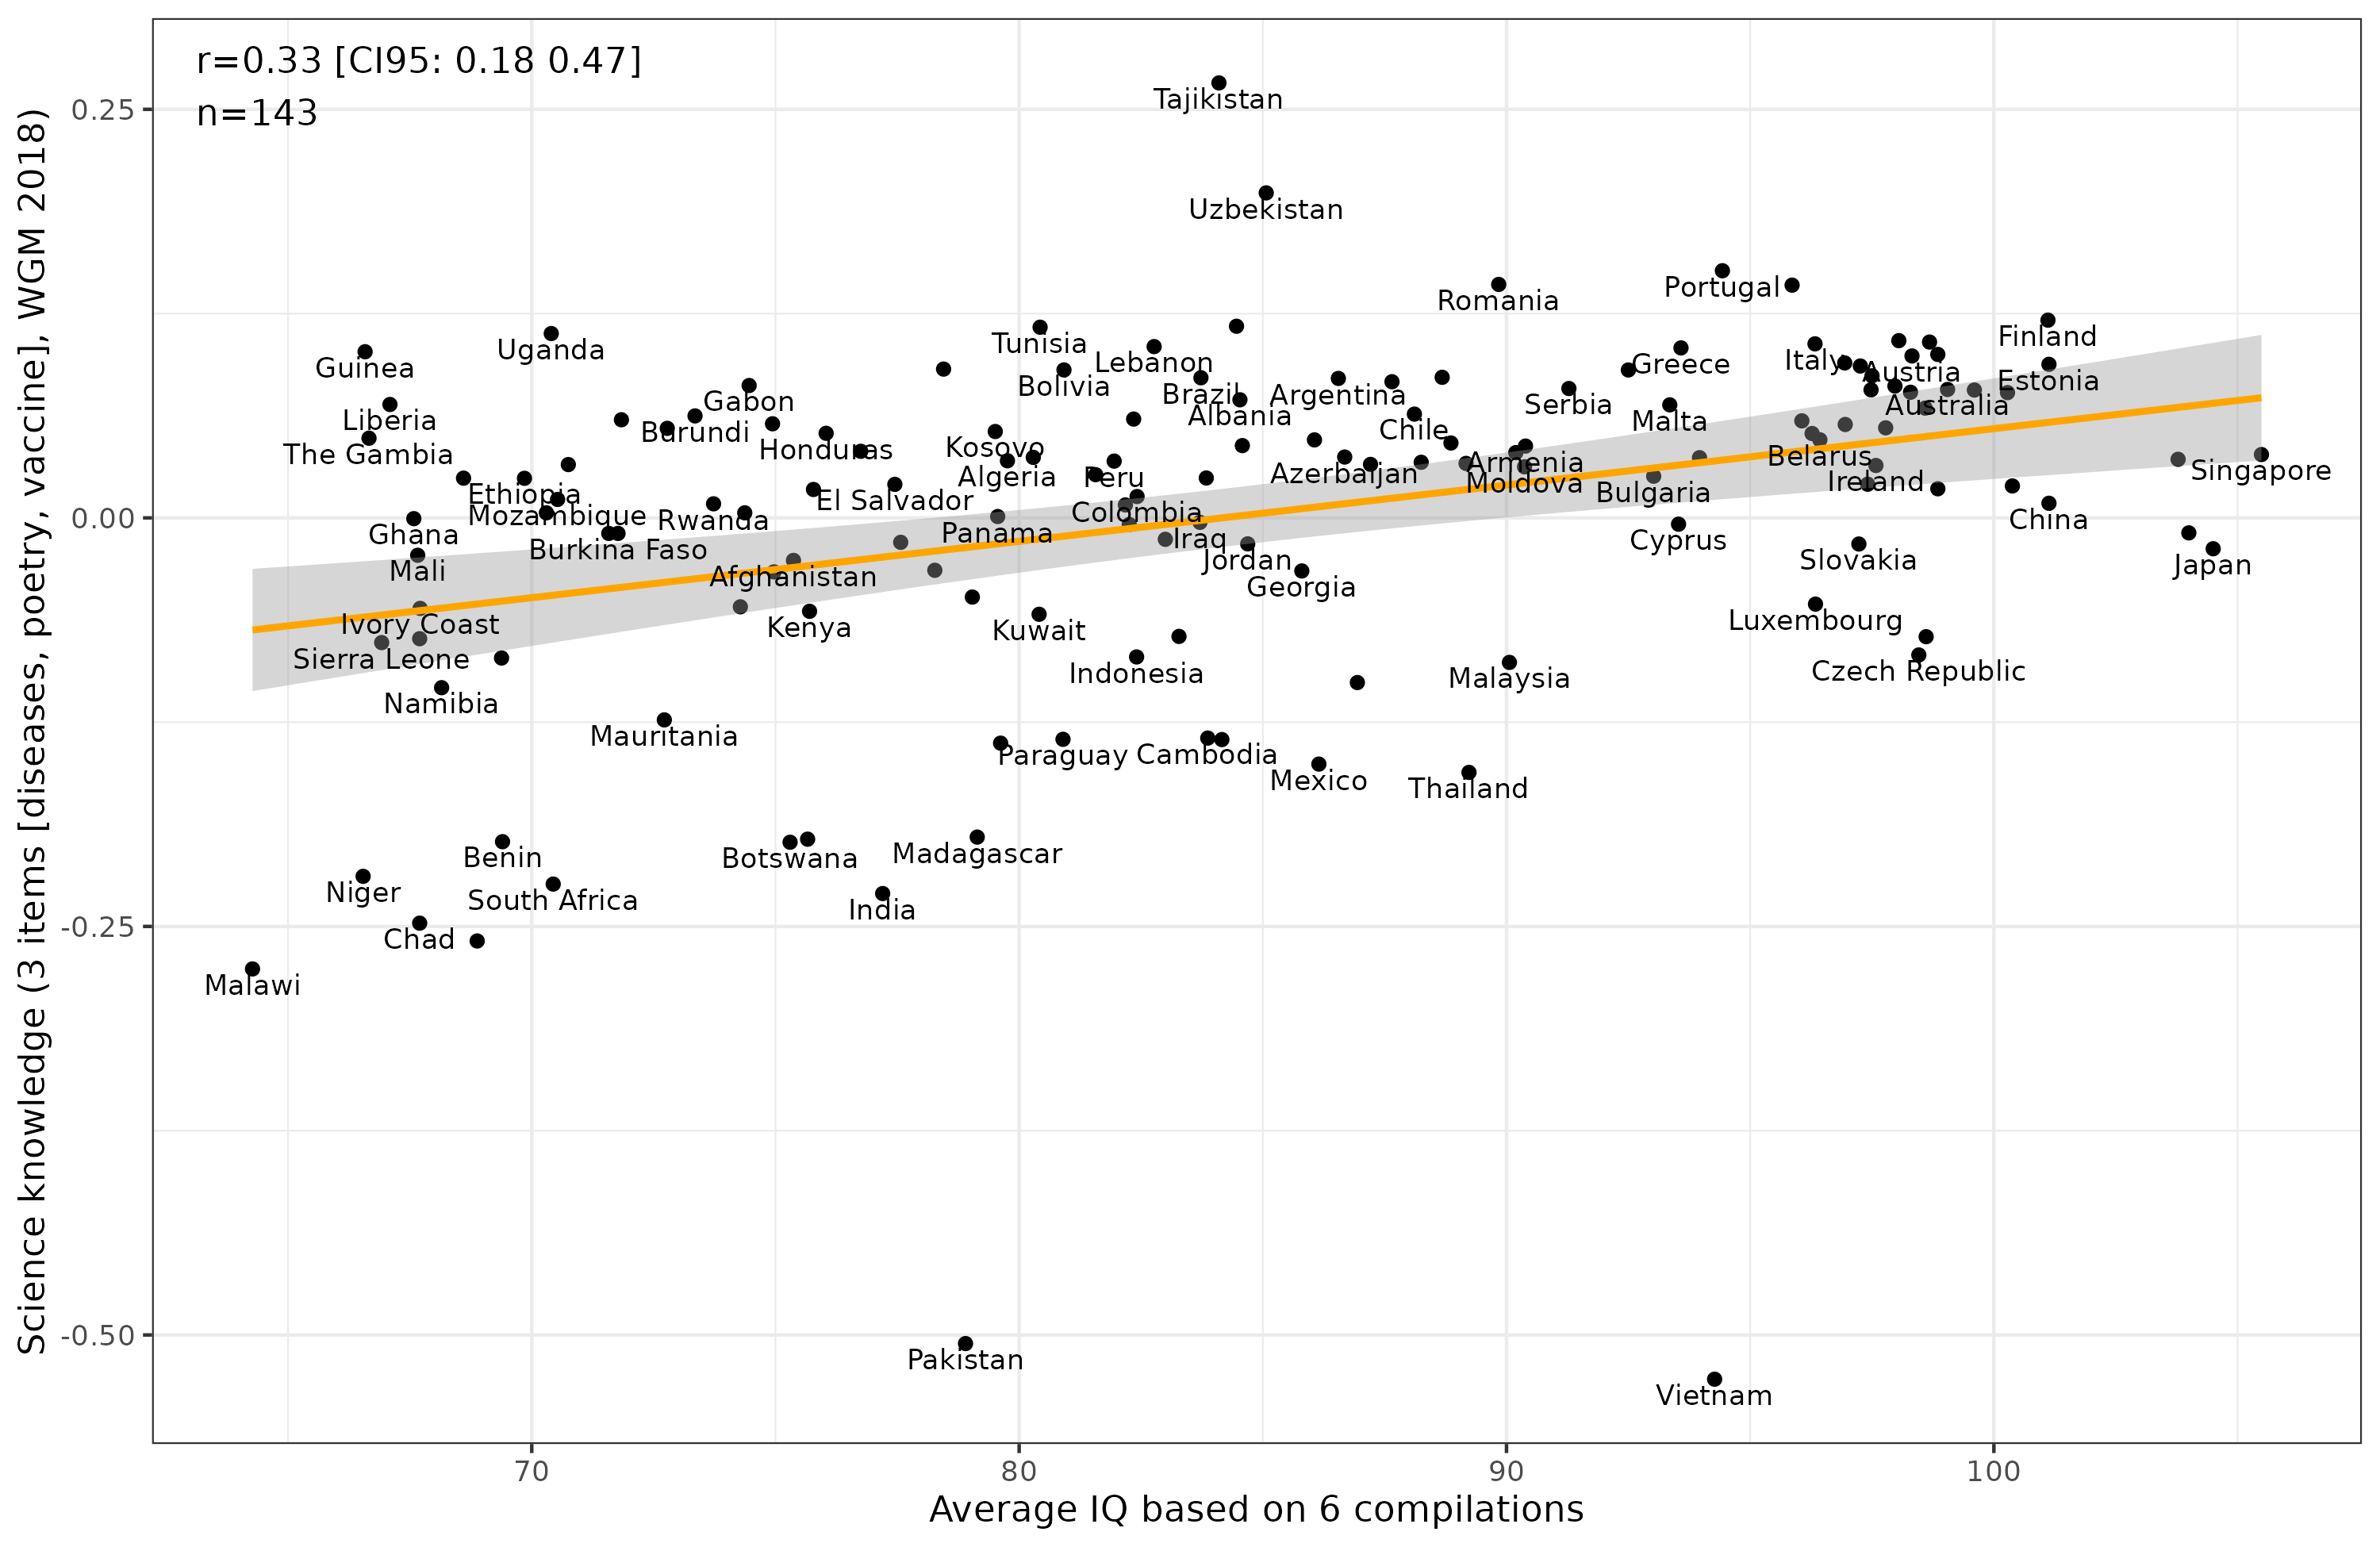
Alas, this did not improve things. There also seems to be something wrong with the Pakistan and Vietnam data. Perhaps they mistranslated the question or messed up the coding in the dataset.
I’m afraid we can’t get much further with this dataset. Here’s my code for those interested.
Summary
- New dataset of 150,000 people from 144 countries sort of provides us with a science knowledge test.
- But the test sucks, with 4 items. There’s no other waves of data we can use either.
- However, if one scores the 4 items, the correlation with national IQ is 0.71. Not too bad.
- Asian countries are big outliers, and this is due to one item asking the subject to state their understanding of something they have read, which measures humility more than it does science understanding. However, removing the item doesn’t make results improve because the other items are even worse.
- Truly a wasted opportunity with the costs of this huge survey. How hard can it be to include 10 simple questions about science?