It is commonly said that heritability is a population level statistic that doesn’t apply to individuals. For instance, here’s Robert Plomin et al’s textbook Behavioral Genetics (2017, 7th edition), the main textbook of the field:
The question about how much genetics contributes to a trait refers to effect size, the extent to which individual differences for the trait in the population can be accounted for by genetic differences among individuals. Effect size in this sense refers to individual differences for a trait in the entire population, not to certain individuals. For example, if PKU were left untreated, it would have a huge effect on the cognitive development of individuals homozygous for the recessive allele. However, because such individuals represent only 1 in 10,000 individuals in the population, this huge effect for these few individuals would have little effect overall on the variation in cognitive ability in the entire population. Thus, the size of the effect of PKU in the population is very small.
Or Cosmides & Tooby’s famous summary of evolutionary psychology (1997):
A heritability coefficient measures sources of variance in a population (for example, in a forest of oaks, to what extent are differences in height correlated with differences in sunlight, all else equal?). It tells you nothing about what caused the development of an individual. Let’s say that for height, 80% of the variance in a forest of oaks is caused by variation in their genes. This does not mean that the height of the oak tree in your yard is “80% genetic.” (What could this possibly mean? Did genes contribute more to your oak’s height than sunlight? What percent of its height was caused by nitrogen in the soil? By rainfall? By the partial pressure of CO2?) When applied to an individual, such percents are meaningless, because all of these factors are necessary for a tree to grow. Remove any one, and the height will be zero. (Cosmides & Tooby 1997)
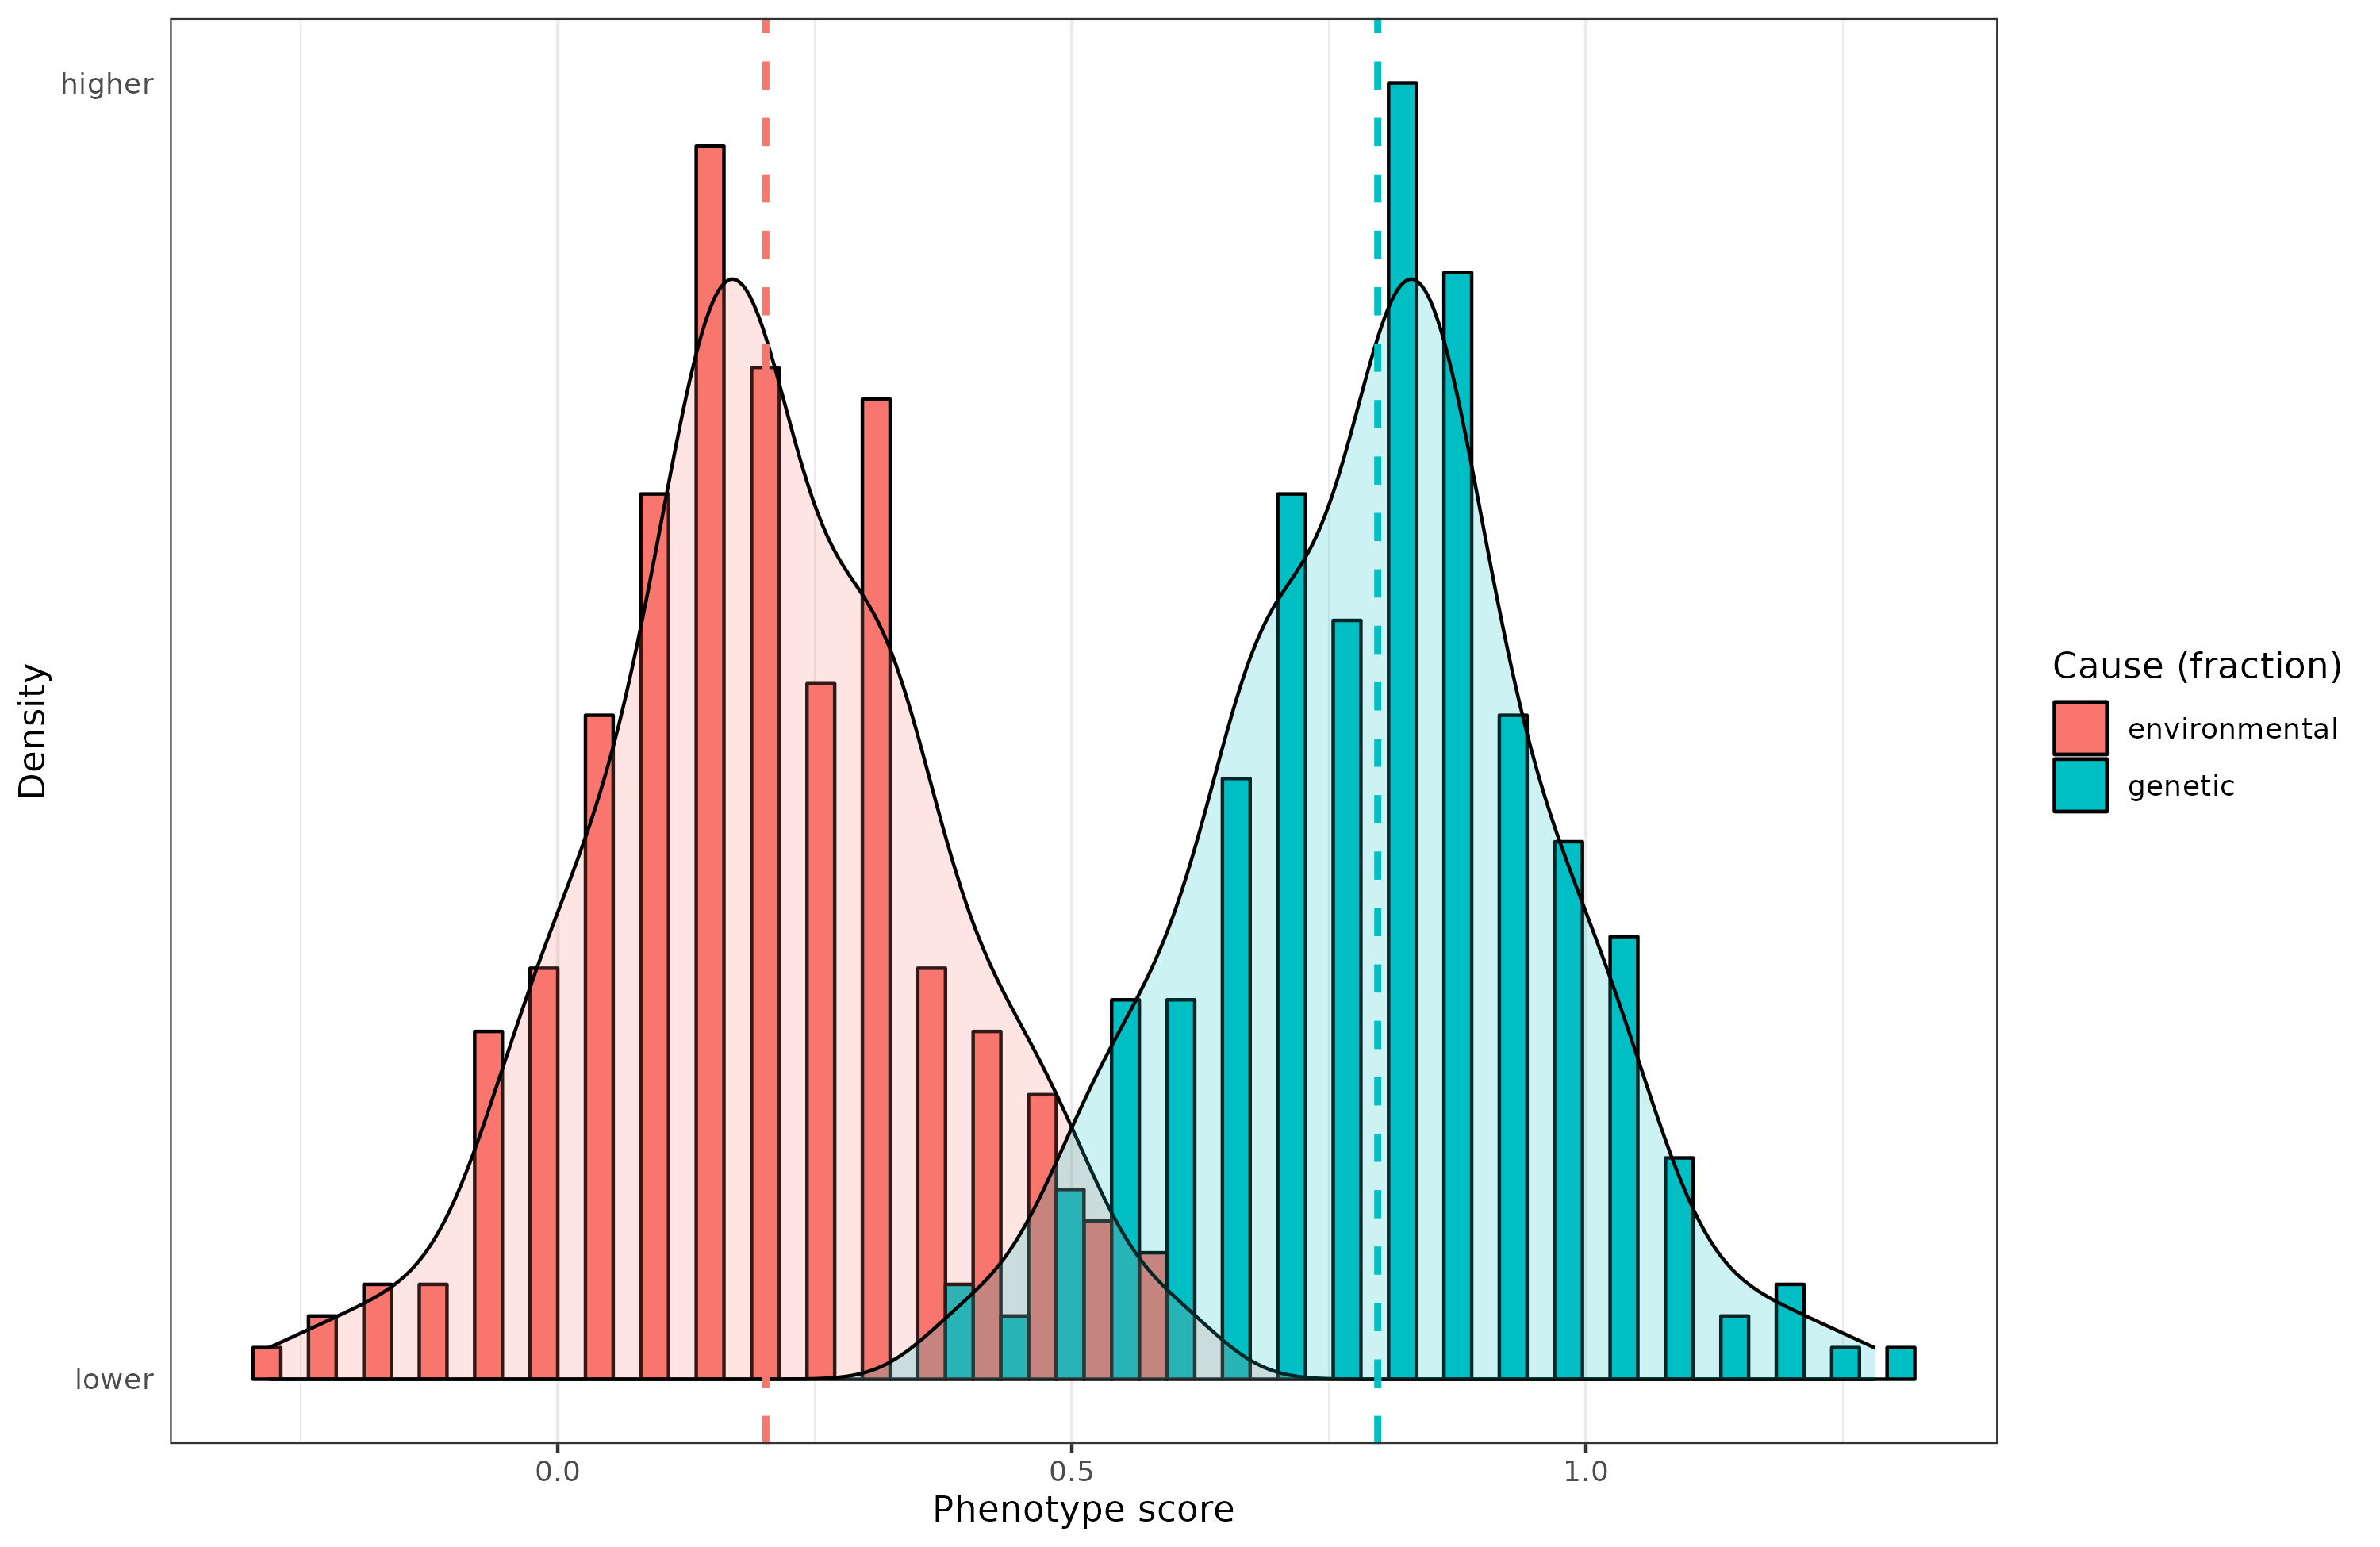
Mathematically, heritability is defined in terms of the variance in a population, and which fraction of that is caused by genetic variation (the heritability), and which fraction is not (‘environmentality’ though this usually includes random biological variation and measurement error). And this is how the discussion usually ends. But it is possible to think of the heritability of a given individual’s phenotype too. This requires some modifications. But consider this situation. I’ve simulated some data with a heritability of 80% which seems typical for many psychological traits when measured well. When the heritability is 80%, this means that the causal path from genetic potential (the “genotype”) to the phenotype is sqrt(0.80) = 0.89. In other words, when the genetic potential goes up by 1 standard deviation (d), the phenotype goes up by 0.89 d. The environmentability is the remaining part of the variance, thus sqrt(0.20) = 0.45. Notice here that while the genetic variance is 4 times as large as the environmental one, the effects of genetics is only twice as high. Variances are deceptive. These values also tell us that the causal genetic factors vary more in the population than the environmental ones, thus a large deviation from the mean is more likely to be due to genetics than environment (this can be quantified too, Tal 2009). To look at this, we can compute each individual’s deviation from the population mean. We can then look at which proportion of this deviation is due to genetics and which is due to environment. This is a kind of heritability metric because it is the genetic part of a proportion, but it is not the same as the usual population variance-based metric. For instance, if we look at those who are 2 or more standard deviations above the mean for this hypothetical phenotype, the causal proportions look like this:
You may notice something weird. Some values are outside of the logically sensible bounds of 0 to 1. How come? This happens when the causes go in the opposite directions. For instance, a given high scoring person with a score of 2 (top 2%) may have extremely good genetics, a score of 3, but a poor environment, a score of -1. The deviation from the mean is +2, but genetics contributed 3 of this, and the environment -1. The individual heritability, in this deviation sense, is thus 3/2 = 150%, while the environmentality is -1/2 = -50%. They sum to 100% as they must, but clearly this is a tricky way to think about the proportions of causation. However, it makes clear what we know must be true: some extraordinary individuals got to where they are from extremely good genetics which overcame their poor environment. Think of the many historical geniuses who grew up in poverty, whose parents died early or who abandoned them, but despite this, they still managed to achieve greatness (e.g. George Carver, born a Black slave in the US South). It can also be the other way around, of course. Some people had poor genetics for a given phenotype, a score of -1, but their causal environment was very good, a score of 2, so they ended up alright in the end, a score of 1. The environmental contribution was thus 2/1 = 200%, and the genetic was -1/1 = -100%. They sum to 100% again. If we look at people whose phenotype are close to the population mean, the individual heritabilities (calculated this way) can be very strange. For instance, if a person has a phenotypic score of 0.1, barely above average, with an environment of 0.5 and a below average genetic score of -0.4, the individual heritability is -0.4/0.1 = -400%, and the environmentality is 0.5/0.1 = 500%. They sum to 100%, but the numbers are absurdly large. They can be made arbitrarily large with large opposite effects of genetics and environment.
As a matter of fact, however, if we take the average of these contributions across the population, the average individual heritability is 80%, and the average environmentability is 20%. These are the same numbers we started with, so there is a connection here between the individual heritabilities and the population statistic. This is also true when we look at a subset of the population, like we did above. The average individual heritability, the population heritability, is also 80% and the environmentality is 20%. Thus, the next time we see a person who is far above average in some phenotype (whether it is athletics, height, or intellectual pursuits) the best guess of the relative contributions is thus the same as the usual population statistics we find reported in the studies.
But we can go further with this kind of reasoning. Humans are well known to construct their own environments, which may also affect a given phenotype. If some human population has the genetically caused skill and wisdom to construct sewers that reduce childhood diseases that cause stunting, their children will be even taller still. If the skill tends to be found in people who are already tall genetically, relative to other humans, we will have found a case of positive active gene-environment correlation. If we took members of another population and moved them to the place with sewers, their children would also grow up to be taller. This effect would be environmentally mediated — by the sewers reducing childhood diseases — but this environmental effect is downstream of a genetic effect of the resident population, not the transplanted population. In other words, the genetics of one population can cause the phenotype of another population.
This matter is quite important for thinking about race differences in intelligence. In African countries, the average IQ is about 70, and they live mostly, but not entirely, in the environment created by Africans, and thus by African genetics. The non-African contribution comes from technology that they have bought, been given, or copied from non-Africans. In the USA, when we do admixture regression studies, we find that the mean IQ of pure Africans is estimated to be about 80. The 10 IQ gain comes from the American environment’s superiority over the African. In one sense, then, we could say that the genetic contribution to the 30 IQ gap between American Europeans and African Africans is 20 IQ, thus a heritability of 67% based on the deviation scores. However, since the American environment that improves African IQ is made mainly by Europeans, this is also a genetic effect that is mediated by the environment. In that sense, then, we might say that the heritability of the 30 IQ gap between African Africans and American Europeans is 100% (30/30=100%), while the heritability of the American African vs. American Europeans is 30/20 = 150%, and the environmental contribution is -10/20 = -50%. They sum to 100%, as they must, but reflect the fact that the environmental effect is decreasing the gap instead of making it larger. To note, this kind of between group heritability based on deviations is not the one that is usually discussed, the DeFries formula. That heritability is based on squared deviation values and thus have the usually deceptive variance component issues. It has the same feature though in that it can be larger than 100% if the causal genetic variance between groups is larger than the phenotypic variance.
If you would like to read more about the details of careful behavioral genetic reasoning, I highly recommend that you read Neven Sesardić’s 2005 book, Making sense of Heritability. It is the best book on the topic of behavioral genetics. It is also thanks to Sesardić that I realized the above line of reasoning.