There are many studies that report correlations between intelligence — however measured — and economic outcomes, mainly (self-reported) income. This is however somewhat abstract since correlations are unitless. They don’t immediately tell you how much an increase of, say, 15 IQ is worth. But there are a few economists who have been looking into this question in monetary values. One such study is this one:
- Hanushek, E. A., Schwerdt, G., Wiederhold, S., & Woessmann, L. (2015). Returns to skills around the world: Evidence from PIAAC. European Economic Review, 73, 103-130.
Existing estimates of the labor-market returns to human capital give a distorted picture of the role of skills across different economies. International comparisons of earnings analyses rely almost exclusively on school attainment measures of human capital, and evidence incorporating direct measures of cognitive skills is mostly restricted to early-career workers in the United States. Analysis of the new PIAAC survey of adult skills over the full lifecycle in 23 countries shows that the focus on early-career earnings leads to underestimating the lifetime returns to skills by about one quarter. On average, a one-standard-deviation increase in numeracy skills is associated with an 18 percent wage increase among prime-age workers. But this masks considerable heterogeneity across countries. Eight countries, including all Nordic countries, have returns between 12 and 15 percent, while six are above 21 percent with the largest return being 28 percent in the United States. Estimates are remarkably robust to different earnings and skill measures, additional controls, and various subgroups. Instrumental-variable models that use skill variation stemming from school attainment, parental education, or compulsory-schooling laws provide even higher estimates. Intriguingly, returns to skills are systematically lower in countries with higher union density, stricter employment protection, and larger public-sector shares.
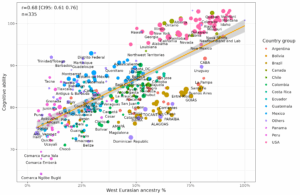
Hanushek and coauthors used the awesome PIAAC dataset, which has 3 ability measures — numeracy, literacy, and problem solving — as well as a large international sample. The best part is that the dataset is public, even at the item level for the ability measures. You can download it here. In total, the sample size is about 36,000 adults from 23 countries. If you are wondering what the questions on the numeracy look like, here’s two examples I was able to find:

A plain count hidden bottles task using spatial and mathematical reasoning. Really, it’s 6 * 4 * 2 = 48.

In the second example, the subject is given a table and plot of the same data. The task is to find 2 errors in the plot. Looks like the answer is June and July, which are swapped.
Rather than use correlations, Hanushek et al used the hourly wage as their outcome. They furthermore log-transformed this, meaning that the units are now interpretable as:
Our starting point is Eq. (6) which expresses log hourly wages as a function of numeracy skills, gender, and a quadratic polynomial in actual work experience for the sample of full-time employees aged 35–54. Since our skill measure is standardized to (0,1), the parameter of interest, γ, can be interpreted as the percentage increase in income associated with a one-standard-deviation increase in measured skills.
By using percentage terms, they sidestep the issue of the many different currencies used across the 23 countries in the dataset. Based on this regression approach, then, one can see which countries provide the best “return to skill” in percentage terms:

Thus, we see that overall, 15 IQ points (on the numeracy test) is worth an increase of 18% in the hourly wage taken as an average across these countries. This is when work experience and sex are taken into account. But it varies between countries, plotted for easy comparison:
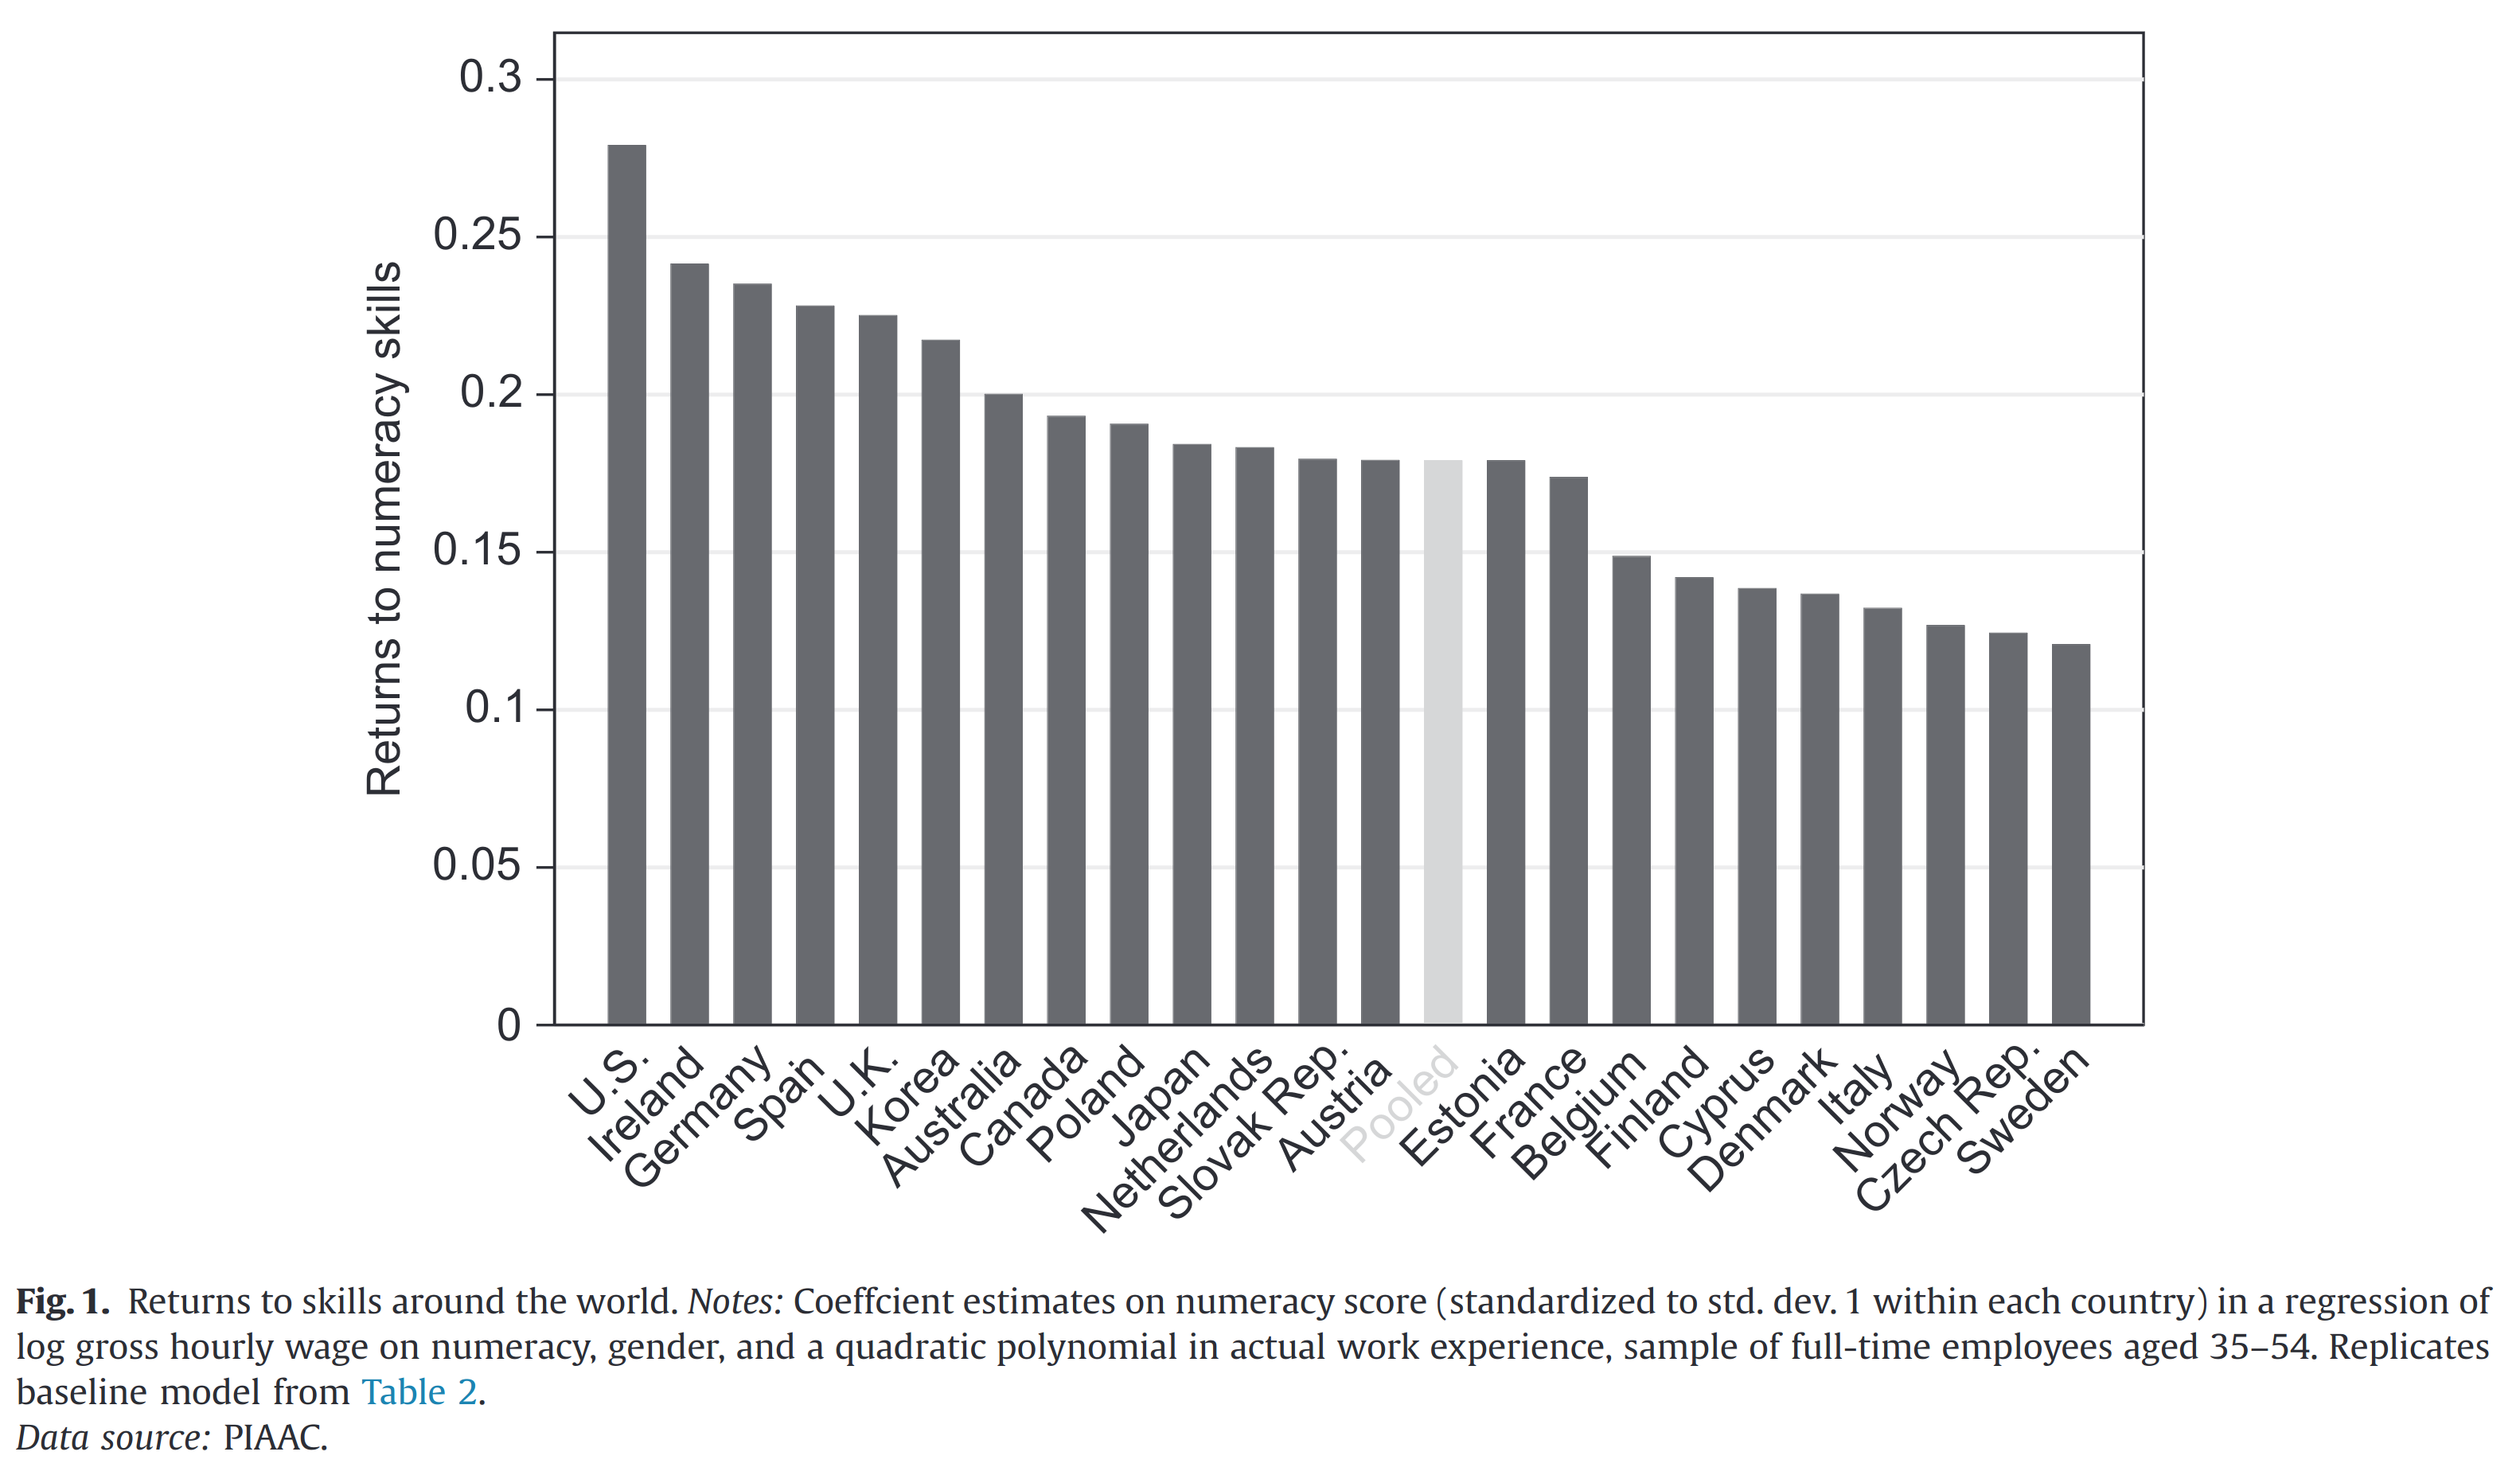
We get the unsurprising result that USA gives the most bang for the IQ buck, and Sweden the lowest: a high of 28% in USA, and 12% in Sweden. In fact, all the Nordic countries are in the bottom, though strangely Germany is near the top. Are they really so different in returns to skill?
Next up, they checked the effect of age. We expect that the value of intelligence increases with years on the job market as smarter people acquire more job-relevant knowledge and work their way into highly paid positions:

This expectation is confirmed. There’s not much value of intelligence in terms of hourly wages for teenagers, but by the late 30s, it has reached the asymptote.
We might also ask: how about education? Presumably, a major reason that smarter workers are paid more is that they acquired more education, which provides both job-relevant knowledge (well, sometimes), and works as a signaling mechanism for employers. Indeed, the results bear this out:

Overall, if we adjust for years of schooling, 15 IQ points are no longer worth 18% on average, but 10%. Roughly the same country differences seem to be present after this adjustment too, with USA as number 2 (14% per 15 IQ), and the UK as number 1 (17% per 15 IQ).
One could also ask: they had 3 different tests, and all of these results concern numeracy, what about the other tests?

Numeracy provides the best returns (or predictions), but it’s only marginally better than literacy. Strangely, problem solving is lower, which is maybe just because of lower reliability. The OECD does not appear to have reported the reliabilities, as least, insofar as the authors could find (their footnote 12). In fact, since the data are available at the item level, one can fit item response theory models and get these. If one had done this, one could examine the relative effects of general intelligence (g), and the orthogonal group factors for numeracy, literacy, and problem solving. These might have shown an interesting pattern.
How about various groups of people? Is intelligence worth more to some than others? Yes:

Intelligence is worth very slightly more to men than women, more to people with better educated parents, more in the private sector, a bit more for natives rather than foreigners, and more to those who work full-time compared to part-time. With regards to the sex difference, the authors note:
As is evident from Table 2, the gender wage gap is 14.9 percent when conditioning on numeracy. In the same model without the numeracy control (not shown), the gender gap is 18.6 percent. Thus, around a fifth of the gender wage gap in the pooled sample is attributable to gender skill differences (which are 19.6 percent of a standard deviation in numeracy skills in this sample).
So on the numeracy test, men scored 0.20 SD, or about 3 IQ higher. This is not so surprising, but it explains statistically about 20% of the gap in hourly wages.
What about measurement error? Since they didn’t find the reliabilities of the tests, they used the economist approach instead: instrumental variables. In this case, they used literacy as their instrument. In other words, they assumed that the effect of literacy on wages is 100% mediated by numeracy. If one grants this probably somewhat incorrect assumption, one can get a measurement error free estimate of numeracy’s effect on wages, which turns out to be 20.1% instead of the initial 17.8% per 15 IQ. We can thus work backwards, and ask: which reliability estimate explains this difference? I think since this is just a matter of finding the value to multiple the slope by, the correction works the same way as with correlations. If so, this would imply a reliability of the numeracy test of 0.201 = 0.178 / sqrt(x), solve for x, x = 0.78. A mediocre value.
Interesting is to ask: what factors explain the different returns between countries? Given there are only 23 countries, this is perhaps not so highly powered a model, but they nevertheless find the obvious candidates work out:

If we look at model 7, which includes all the covariates, we see that unions, employee protection, and size of public sector attain p < .05. In other words, labor market regulation and Nordic-style market socialism seem to decrease the absolute value of intelligence between people inside that country. This is not too surprising as unions tend to negotiate fixed salaries for jobs, employee protections make the job market inflexible by making it hard to fire people and hire someone else more productive (or less annoying).
Also interestingly, they looked at alternative outcome variables. All the results above concern log wages per hour. But what about monthly wages?

Looking across the various wage based metrics, it seems that using longer time-spans (months rather than hours) and more inclusive counting (bonuses) increases the value a bit. This is expected insofar as we interpret the simple hourly wage as a proxy for a latent variable of permanent income. The more parts of this we measure, the stronger the result. Of particular interest above is the “position in wage distribution”, which is how many centiles in the income distribution 15 IQ moves you up. This is close to a correlation-type metric because it doesn’t depend on how flat the income distribution is, just how closely one can predict relative position in the wage distribution from the test score. Here we see that the Nordic countries with poor returns to skill are actually very meritocratic: in Norway, 15 IQ moves you 11.5 centiles up, in Denmark, 11.6 centiles, compared to 12.5 and 12.3 for the US and UK, respectively. The difference is largely gone. This implies that the difference in returns to skill mainly has to do with the flatness (dispersion) of the income distribution. On the other hand, in Italy the effect is only 6.5 centiles, which is quite low. Perhaps this is due to the large regional differences (rich north vs. poor south Italy). That sounds plausible, but there are other countries with similarly low values which don’t have obvious large regional disparities, e.g. Czech Republic 7.7, and Cyprus 6.7.
All I want is money
Suppose you are in this for the money. If you are a bright person, moving to the USA seems like a good choice, also given it’s high baseline of salaries. But wait, what about having a US-based remote job and living somewhere else? There’s 2 more factors to take into account: taxes and cost of living. Assuming you don’t have US citizenship (which tax you even when you don’t live there), you could possibly obtain a highly paid US remote job, but live somewhere with low taxes. So where to go to? The Tax Foundation provides a useful comparison for 2019:

Note that these are top marginal taxes:
The top effective marginal tax rate is the total tax paid on the last dollar earned by a high-earning worker, taking social security contributions and consumption tax es into account in addition to income taxes. It is a measure of the degree of progressivity and redistribution in the tax system. As such, it is of great policy interest.
So, again assuming you are a smart high-earner, it seems that legally moving to Bulgaria is a good idea, at least insofar as you want to stay in the West somewhere. If you don’t care about this, you could move to Dubai with 0% income tax.
Living costs are basically just a function of the level of development of the country, so this comes down to how much garbage on the street you can tolerate. If you are fine with living in a gated community, then there’s a lot of options in the world, say, Mexico or Southeast Asia offer decently low living costs and low-ish taxes. Inside the West, it seems Bulgaria is the way to go.
Takeaway
- Intelligence, here proxied by a numeracy test, is highly valuable on the job market, each 15 IQ gives a raise of about 20%.
- This pattern was found across 20+ rich countries.
- There were large differences in the return to skill, with USA and UK being particularly large, and Nordic countries low. However, this was not true when one considers not the absolute return, but relative position return.