- Lasker, J., Pesta, B. J., Fuerst, J. G., & Kirkegaard, E. O. W. (2019). Global Ancestry and Cognitive Ability. Psych, 1(1), 431-459.
This is our largest admixture project to date, pulling together the evidence using polygenic scores and global admixture analysis (see previous posts). We confirm all the usual hereditarian predictions using a large sample of European and African American kids and youth from the PNC/TCP sample. The dataset also has other groups, mainly about 500 Hispanics, but we left these out to simplify the analysis and its presentation. Many people found our previous PING study hard to understand, so we felt this was needed. Specifically, we showed that:
- Measurement issues can be analyzed with both Jensen’s method (correlated vectors) and MGCFA, and they give similar results, i.e. lack of notable bias. Table 1 shows MGCFA results. We have more work coming out on this question with the same conclusion but more in depth item-based methods.
- In line with previous Jensen method findings, we show that there is a positive manifold among the tests: higher g-loadings, heritability, group gaps (genetic measured or not) etc., all relate positively. Table 14 shows these results.
- Genetic ancestry (based on DNA) predicts intelligence in the way expected based on the hereditarian model. This predictive power doesn’t go entirely away if one controls for parental education, own skin color, or (current) polygenic scores. Results shown in Tables 4-8, 10-13, Figures 3-5.
- Polygenic scores for education/IQ works for both European and African descent people in the PNC. It works better for the European ones, as expected, but about half the validity is retained in the Africans. This makes them a biased genetic measure but not a useless one. We show using this that the PGS mediates some of the ancestry effect, a prediction from the hereditarian model. A perfect PGS is expected to completely mediate the predictive power of genetic ancestry, so we expect as stronger GWASs are published, this will increasingly occur. In fact, we should have shown this by using the older GWASs. Results in Table 8 and Figure 4.
For a good quantitative background on understanding the results, I recommend reading the simulations we published in the PING paper supplement. It goes over why we modeled the data in this way since we simulated polygenic group differences and admixture analysis from first principles and showed the methods make sense. If you want the R code for that to play with it yourself, it can be found here.
Coverage by others:
- Reddit threads: r/heredity
- Inductivist: Blockbuster study on the black-white gap in intelligence
- Steve Sailer: “Global Ancestry and Cognitive Ability”, also on VDare
Main figures and tables:
Table 1. Factor score differences between African and European-Americans based on the Weak Spearman’s Hypothesis Model.
| Factor | Estimate | SE | Lower 95% CI | Upper 95% CI |
|---|---|---|---|---|
| g | 1.046 | 0.020 | 1.007 | 1.085 |
| Complex Reasoning | 0.356 | 0.026 | 0.305 | 0.407 |
| Executive Functioning | −0.055 | 0.028 | −0.109 | −0.0001 |
| Episodic Memory | 0 | – | – | – |
—

Figure 1. Probability distribution for identifying as African-, biracial African-European, and European-American as a function of genetic ancestry for the Trajectories of Complex Phenotypes (TCP) sample.
—

Figure 2. Regression plot of the relation between color (with higher values indicating darker color) and European genetic ancestry.
—
Table 2. Sample characteristics for the African, European, and biracial African-European-American participants.
| Age (SD; N) | % European (SD; N) | Mean SES (SD; N) | Mean g Score (SD; N) | Mean Color (SD; N) | |
|---|---|---|---|---|---|
| African | 14.08 (3.75; 2227) | 0.187 (0.117; 2228) | −0.57 (0.77; 2180) | −1.01 (1.07; 2179) | 30.96 (5.87; 1557) |
| Biracial African-European | 13.15 (3.58; 232) | 0.796 (0.289; 232) | 0.16 (0.95; 230) | −0.14 (1.05; 228) | 19.18 (7.61; 166) |
| European | 13.76 (3.64; 4937) | 0.986 (0.059; 4939) | 0.33 (0.96; 4909) | 0.00 (1.01; 4914) | 14.70 (3.84; 3862) |
Note: Standard deviations and sample sizes appear in parentheses. SES = socioeconomic status.
—
Table 3. Pairwise correlations among African-, African-European, and European-Americans.
| Cognitive Ability | SES | Euro. Ancestry | Afr. Ancestry | SIRE EA | SIRE AA | Color | EduPGS | |
|---|---|---|---|---|---|---|---|---|
| Cognitive Ability | 1 | |||||||
| SES | 0.406 (7253) | 1 | ||||||
| European Ancestry | 0.411 (7321) | 0.412 (7319) | 1 | |||||
| African Ancestry | −0.411 (7321) | −0.412 (7319) | −1.000 (7399) | 1 | ||||
| SIRE EA | 0.408 (7321) | 0.413 (7319) | 0.964 (7399) | −0.964 (7399) | 1 | |||
| SIRE AA | −0.387 (7321) | −0.395 (7319) | −0.928 (7399) | 0.928 (7399) | -0.930 (7399) | 1 | ||
| Color | −0.359 (5534) | −0.354 (5530) | −0.875 (5585) | 0.875 (5585) | −0.838 (5585) | 0.812 (5585) | 1 | |
| EduPGS | 0.402 (7321) | 0.445 (7319) | 0.672 (7399) | −0.672 (7399) | 0.645 (7399) | −0.630 (7399) | −0.614 (7399) | 1 |
Note: All values significant at p < 0.0001. Pairwise N in parentheses. SES = socioeconomic status, SIRE = self-identified race/ethnicity, eduPGS = education polygenic score.
—
Table 4. Pairwise correlations among self-identified monoracial African-American (below the diagonal) and self-identified monoracial and biracial African-European-American (above the diagonal).
| Cognitive Ability | SES | Euro. Ancestry | Afro. Ancestry | Color | EduPGS | |
|---|---|---|---|---|---|---|
| Cognitive Ability | 1 | 0.315 * (2367) | 0.251 * (2407) | −0.251 * (2407) | −0.188 * (1690) | 0.212 * (2407) |
| SES | 0.256 * (2140) | 1 | 0.276 * (2410) | −0.276 * (2410) | −0.184 * (1690) | 0.244 * (2410) |
| European Ancestry | 0.086 * (2179) | 0.054 * (2180) | 1 | −1.000 * (2460) | −0.639 * (1723) | 0.522 * (2460) |
| African Ancestry | −0.086 * (2179) | −0.054 * (2180) | −1.000 * (1854) | 1 | 0.639 * (1723) | −0.522 * (2460) |
| Color | −0.084 * (1526) | −0.047 (1524) | −0.389 * (1557) | 0.389 * (1557) | 1 | −0.394 * (1723) |
| EduPGS | 0.112 * (2179) | 0.119 * (2180) | 0.328 * (2228) | −0.328 * (2228) | −0.187 * (1557) | 1 |
Note: * Significant at p < 0.01. Pairwise N in parentheses. SES = socioeconomic status, eduPGS = education polygenic score.
—
Table 5. Regression analysis for European ancestry as a predictor of g among monoracial African-Americans with controls for skin color (Model 2), and SES (Model 3) added.
| Model 1 | Model 1b | Model 2 | Model 3 | |||||||||
|---|---|---|---|---|---|---|---|---|---|---|---|---|
| Predictor | B | SE | β | B | SE | β | B | SE | β | B | SE | β |
| Intercept | −1.16 | 0.04 | −1.01 | −0.82 | 0.06 | −0.997 | −1.05 | 0.09 | −0.996 | −0.83 | 0.09 | −0.995 |
| EUR | 0.78 *** | 0.19 | 0.09 *** | 0.83 *** | 0.24 | 0.10 *** | 0.67 ** | 0.23 | 0.08 ** | |||
| Skin Color | −0.13 *** | 0.04 | −0.09 *** | −0.07 | 0.04 | −0.05 | −0.06 | 0.04 | −0.04 | |||
| SES | 0.36 *** | 0.03 | 0.28 *** | |||||||||
| Adjusted R2 | 0.007 | 0.006 | 0.013 | 0.082 | ||||||||
| N | 2179 | 1526 | 1526 | 1500 | ||||||||
Note: * p < 0.05, ** p < 0.01, *** p < 0.001. Model 1b shows the results with color as an alternative predictor. EUR = European ancestry. SES = socioeconomic status.
—
Table 6. Regression analysis for European ancestry as a predictor of g among monoracial and biracial African-European-Americans with controls for SIRE (Model 2), skin color (Model 3b), and SES (Model 4) added.
| Model 1 | Model 2 | Model 3a | Model 3b | Model 4 | ||||||
|---|---|---|---|---|---|---|---|---|---|---|
| Predictor | B | SE | B | SE | B | SE | B | SE | B | SE |
| Intercept | −1.22 | 0.03 | −1.17 | 0.04 | −0.62 | 0.05 | −1.07 | 0.08 | −0.83 | 0.08 |
| EUR | 1.21 *** | 0.09 | 0.85 *** | 0.15 | 0.80 *** | 0.19 | 0.55 ** | 0.19 | ||
| SIRE: EA | 0.35 ** | 0.12 | 0.27 * | 0.13 | 0.18 | 0.13 | ||||
| Skin Color | −0.25 *** | 0.03 | −0.06 | 0.04 | −0.05 | 0.04 | ||||
| SES | 0.37 | 0.03 | ||||||||
| Adjusted R2 | 0.063 | 0.066 | 0.035 | 0.065 | 0.134 | |||||
| N | 2407 | 2407 | 1690 | 1690 | 1664 | |||||
Note: * p < 0.05, ** p < 0.01, *** p < 0.001. EUR = European ancestry. SES = socioeconomic status, SIRE = self-identified race/ethnicity.
—

Figure 3. Regression plot for the relation between g and European ancestry (r = 0.411).
—
Table 7. Regression analysis for European ancestry as a predictor of g among African-, European-, and biracial African-European-Americans with controls for SIRE (Model 2) skin color (Model 3), and SES (Model 4) Added.
| Model 1 | Model 2 | Model 3a | Model 3b | Model 4 | ||||||
|---|---|---|---|---|---|---|---|---|---|---|
| Predictor | B | SE | B | SE | B | SE | B | SE | B | SE |
| Intercept | −1.22 | 0.03 | −1.15 | 0.09 | −0.28 | 0.01 | −1.09 | 0.11 | −0.91 | 0.11 |
| EUR | 1.23 *** | 0.03 | 0.75 *** | 0.13 | 0.74 *** | 0.16 | 0.59 *** | 0.15 | ||
| SIRE: EA | 0.41 *** | 0.11 | 0.35 ** | 0.12 | 0.22 * | 0.11 | ||||
| SIRE: AA | 0.00 | 0.08 | −0.02 | 0.09 | 0.01 | 0.08 | ||||
| Skin Color | −0.40 *** | 0.01 | −0.02 | 0.03 | −0.01 | 0.03 | ||||
| SES | 0.34 *** | 0.01 | ||||||||
| Adjusted R2 | 0.169 | 0.170 | 0.129 | 0.166 | 0.238 | |||||
| N | 7321 | 7321 | 5534 | 5534 | 5488 | |||||
Note: * p < 0.05, ** p < 0.01, *** p < 0.001. EUR = European ancestry. SES = socioeconomic status, SIRE = self-identified race/ethnicity.
—
Table 8. Pairwise correlations between cognitive ability and education/intelligence-related polygenic scores (European-American above the diagonal, African-American below).
| Cognitive Ability | Putative Causal | GWAS_edu PGS | MTAG_10K_eduPGS | MTAG_Lead eduPGS |
|
|---|---|---|---|---|---|
| Cognitive Ability | 1 | 0.058 *** (4914) | 0.225 *** (4914) | 0.227 *** (4914) | 0.210 *** (4914) |
| Putative Causal_edu PGS | 0.031 (2179) |
1 | 0.216 *** (4939) | 0.315 *** (4939) | 0.348 *** (4939) |
| GWAS_edu PGS | 0.044 * (2179) | 0.135 *** (2228) | 1 | 0.645 *** (4939) | 0.574 *** (4939) |
| MTAG_10K_eduPGS | 0.112 *** (2179) | 0.228 *** (2228) | 0.484 *** (2228) | 1 | 0.837 *** (4939) |
| MTAG_Lead_PGS | 0.094 *** (2179) | 0.266 *** (2228) | 0.453 *** (2228) | 0.801 *** (2228) | 1 |
Note: * Significant at p < 0.05; ** Significant at p < 0.01; *** Significant at p < 0.001. N in parentheses. GWAS = genome-wide association study (standard one-at-a-time regression), MTAG = multi-trait analysis of GWAS, eduPGS = education polygenic score, lead = genome wide-
—

Figure 4. Regression plot for the predictive validity of MTAG 10k eduPGS with Respect to g in the African-American (Red; r = 0.112) and European-American (Blue; r = 0.227) Samples.
—
Table 9. Mean racial differences in eduPGS (MTAG_10k).
| N | M | SD | |
|---|---|---|---|
| European-American | 4939 | 0.00 | 1.00 |
| Biracial African-European-American | 232 | −0.59 | 1.15 |
| African-American | 2228 | −1.79 | 0.81 |
—
Table 10. Regression results for the effect of eduPGS on cognitive ability among monoracial African-Americans.
| Model 1b | Model 2b | |||
|---|---|---|---|---|
| Predictor | B | SE | B | SE |
| Intercept | −0.88 | 0.08 | −0.75 | 0.12 |
| EUR | 0.50 * | 0.21 | 0.51 * | 0.25 |
| eduPGS | 0.12 *** | 0.03 | 0.13 *** | 0.04 |
| Color | −0.07 | 0.04 | ||
| Adjusted R2 | 0.014 | 0.021 | ||
| N | 2179 | 1526 |
Note: * p < 0.05, ** p < 0.01, *** p < 0.001. EUR = European ancestry. eduPGS = education polygenic score.
—
Table 11. Regression results for the effect of eduPGS on cognitive ability among African, biracial African-European, and European-Americans.
| Model 1b | Model 2b | |||
|---|---|---|---|---|
| Predictor | B | SE | B | SE |
| Intercept | −0.73 | 0.09 | −0.64 | 0.12 |
| EUR | 0.29 * | 0.13 | 0.27 | 0.16 |
| SIRE: EA | 0.44 *** | 0.10 | 0.37 ** | 0.11 |
| SIRE: AA | 0.04 | 0.07 | 0.01 | 0.09 |
| eduPGS | 0.21 *** | 0.01 | 0.20 *** | 0.01 |
| Color | −0.01 | 0.03 | ||
| Adjusted R2 | 0.200 | 0.196 | ||
| N | 7321 | 5534 |
Note: * p < 0.05, ** p < 0.01, *** p < 0.001. EUR = European ancestry. SES = socioeconomic status, SIRE = self-identified race/ethnicity, eduPGS = education polygenic score.
—
Table 12. Regression results for the effect of eduPGS on cognitive ability among European-Americans.
| Model 1 | Model 2 | Model 3 | ||||
|---|---|---|---|---|---|---|
| Predictor | B | SE | B | SE | B | SE |
| Intercept | −0.45 | 0.25 | 0.02 | 0.24 | −0.03 | 0.27 |
| EUR | 0.45 | 0.25 | −0.02 | 0.24 | 0.04 | 0.28 |
| eduPGS | 0.23 *** | 0.01 | 0.22 *** | 0.02 | ||
| Color | 0.02 | 0.04 | ||||
| Adjusted R2 | 0.000 | 0.051 | 0.50 | |||
| N | 4914 | 4914 | 3844 | |||
Note: * p < 0.05, ** p < 0.01, ** p < 0.001. EUR = European ancestry. SES = socioeconomic status, SIRE = self-identified race/ethnicity, eduPGS = education polygenic score.
—
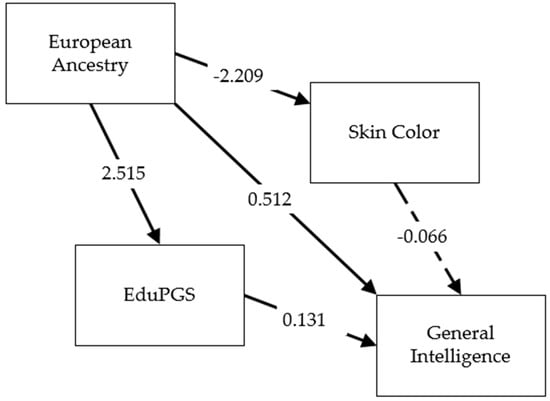
Figure 5. Path diagram for relation between European Ancestry, color, eduPGS, and g in the African-American sample.
—
Table 13. Detailed results for path diagram.
| Unstandardized Estimate | S.E. | P value | Lower 95% CI | Upper 95% CI | Standardized Estimate | |||
|---|---|---|---|---|---|---|---|---|
| EUR | ➜ | G | 0.512 | 0.255 | 0.045 | 0.013 | 1.012 | 0.059 |
| EUR | ➜ | eduPGS | 2.515 | 0.156 | 0.000 | 2.209 | 2.821 | 0.381 |
| eduPGS | ➜ | G | 0.131 | 0.036 | 0.000 | 0.060 | 0.202 | 0.099 |
| Skin Color | ➜ | G | −0.066 | 0.043 | 0.120 | −0.150 | 0.017 | 0.043 |
| EUR | ➜ | Skin Color | −2.209 | 0.133 | 0.000 | −2.469 | −1.949 | −0.392 |
| Skin Color | ~ | eduPGS | −0.020 | 0.012 | 0.089 | −0.044 | 0.003 | −0.044 |
Note: EUR = European ancestry.
—
Table 14. Results from Jensen’s Method of Correlated Vectors.
| g Loading | B-W h2 | Ancestry r | eduPGS r (European-American) | eduPGS r (African American) | African/European Gap | |
|---|---|---|---|---|---|---|
| g loading | 1 | |||||
| B-W h2 | 0.372 | 1 | ||||
| Ancestry r | 0.941 | 0.467 | 1 | |||
| eduPGS r (European-American) | 0.892 | 0.604 | 0.993 | 1 | ||
| eduPGS r (African-American) | 0.901 | 0.600 | 0.836 | 0.846 | 1 | |
| African/European gap | 0.929 | 0.478 | 0.997 | 0.926 | 0.813 | 1 |
Note: N (subtest) = 10. eduPGS = education polygenic score, h² = heritability.