I’ve always considered myself a very rational and fairly unbiased person. Being aware of the general tendency for people to overestimate themselves (see also visualization of the Dunning-Kruger effect), this of course reduces my confidence in my own estimates of these. So what better to do than take some actual tests? I have previously taken the short test of estimation ability found in What intelligence tests miss and got 5/5 right. This is actually slight evidence of underconfidence since I was supposed to give 80% confidence intervals. This of course means that I should have had 1 error, not 0. Still, with 5 items, the precision is too low to say whether I’m actually underconfident or not with much certainty, but it shows that I’m unlikely to be strongly overconfident. Underconfidence is expected for smarter people. A project of mine is to make a test with the confidence intervals that is much longer so to give more precise estimates. It should be fairly easy to find a lot of numbers for stuff and have people give 80% confidence intervals for the numbers. Stuff like the depth of the deepest ocean, height of tallest mountain, age of oldest living organism, age of the Earth/universe, dates for various historical events such as ending of WW2, beginning of American Civil war, and so on.
However, I recently saw an article about a political bias test. I think I’m fairly unbiased. As a result of this, my beliefs don’t really fit into any mainstream political theory. This is as expected because the major political ideologies were invented before we understood much about anything, thus making it unlikely that they would tend to get everything right. More likely, they would probably get some things right and some things wrong.
Here’s my test results for political bias:
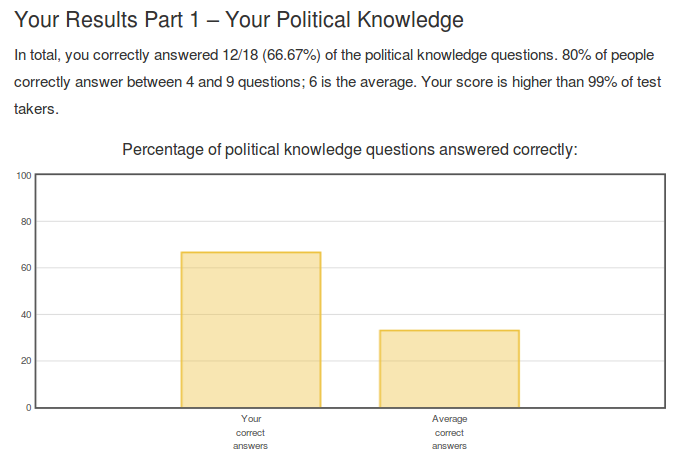
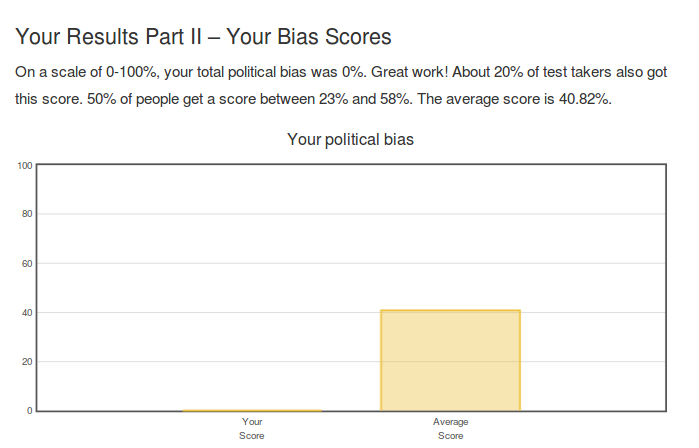
So in centiles: >= 99th for knowledge of American politics. This is higher than I expected (around 95th). Since I’m not a US citizen, presumably the test has some bias against me. For bias, the centile is <= 20th. This result did not surprise me. However, since there is a huge floor effect, this test needs more items to be more useful.
Next up, I looked at the website and saw that they had a number of other potentially useful tests. One is about common misconceptions. Now since I consider myself a scientific rationalist, I should do fairly well on this. Also because I have read somewhat extensively on the issue (Wikipedia list, Snopes and 50 myths of pop psych).
Unfortunately, they present the results in a verbose form. Pasting 8 images would be excessive. I will paste some of the relevant text:
1. Brier score
Your total performance across all quiz and confidence questions:
85.77%This measures your overall ability on this test. This number above, known as a “Brier” score, is a combination of two data points:
How many answers you got correct
Whether you were confident at the right times. That means being more confident on questions you were more likely to be right about, and less confident on questions you were less likely to get right.The higher this score is, the more answers you got correct AND the more you were appropriately confident at the right times and appropriately uncertain at the right times.
Your score is above average. Most people’s Brier’s scores fall in the range of 65-80%. About 5% of people got a score higher than yours. That’s a really good score!
2. Overall accuracy
Answers you got correct: 80%
Out of 30 questions, you got 24 correct. Great work B.S. detector! You performed above average. Looks like you’re pretty good at sorting fact from fiction. Most people correctly guess between 16 and 21 answers, a little better than chance.
Out of the common misconceptions we asked you about, you correctly said that 12/15 were actually B.S. That’s pretty good!
No centiles are provided, so it is not evident how this compares to others.
3. Total points

As for your points, this is another way of showing your ability to detect Fact vs. B.S. and your confidence accuracy. The larger the score, the better you are at doing both! Most people score between 120 and 200 points. Looks like you did very well, ending at 204 points.
4. Reliability of confidence intervals
Reliability of your confidence levels: 89.34%
Were you confident at the right times? To find out, we took a portion of your earlier Brier score to determine just how reliable your level of confidence was. It looks like your score is above average. About 10% of people got a score higher than yours.
This score measures the link between the size of your bet and the chance you got the correct answer. If you were appropriately confident at the right times, we’d expect you to bet a lot of points more often when you got the answer correct than when you didn’t. If you were appropriately uncertain at the right times, we’d expect you to typically bet only a few points when you got the answer wrong.
You can interpret this score as measuring the ability of your gut to distinguish between things that are very likely true, versus only somewhat likely true. Or in other words, this score tries to answer the question, “When you feel more confident in something, does that actually make it more likely to be true?”
5. Confidence and accuracy
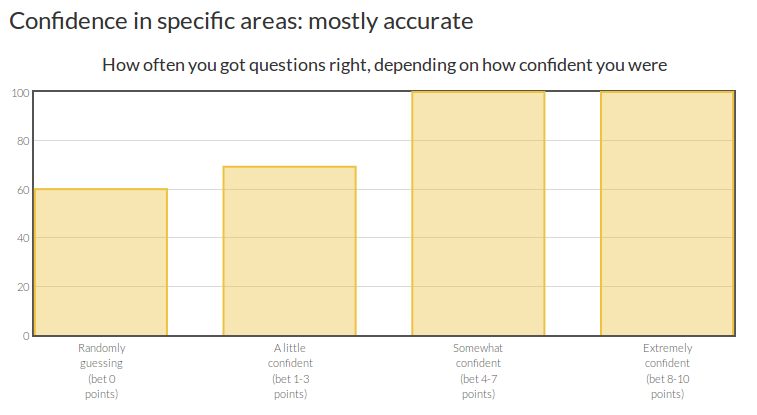
When you bet 1-3 points your confidence was accurate. You were a little confident in your answers and got the answer correct 69.23% of the time. Nice work!
When you bet 4-7 points you were underconfident. You were fairly confident in your answers, but you should have been even more confident because you got the answer correct 100% of the time!
When you bet 8-10 points your confidence was accurate. You were extremely confident in your answer and indeed got the answer correct 100% of the time. Great work!
So, again there is some evidence of underconfidence. E.g. for those I betted 0 points, I still had 60% accuracy, tho it should have been 50%.
6. Overall confidence
Your confidence: very underconfident
You tended to be very underconfident in your answers overall. Let’s explore what that means.
In the chart above, your betting average has been translated into a new score called your “average confidence.” This represents roughly how confident you were in each of your answers.
People who typically bet close to 0 points would have an average confidence near 50% (i.e. they aren’t confident at all and don’t think they’ll do much better than chance).
People who typically bet about 5 points would have an average confidence near 75% (i.e. they’re fairly confident; they might’ve thought there was a ¼ chance of being wrong).
People who typically bet 10 points would have an average confidence near 100% (i.e. they are extremely confident; they thought there was almost no chance of being wrong).The second bar is the average number of questions you got correct. You got 24 questions correct, or 80%.
If you are a highly accurate better, then the two bars above should be about equal. That is, if you got an 80% confidence score, then you should have gotten about 80% of the questions correct.
We said you were underconfident because on average you bet at a confidence level of 69.67% (i.e. you bet 3.93 on average), but in reality you did better than that, getting the answer right 80% of the time.
In general, results were in line with my predictions: high ability + general overestimation + imperfect correlation of self-rated ability and actual ability results in underconfidence. My earlier result indicated some underconfidence as well. The longer test gave the same result. Apparently, I need to be more confident in myself. This is despite the fact that I scored 98 and 99 on the assertiveness facet on the OCEAN test on two different test taking sessions with some months in between.
I did take their additional rationality test, but since this was just based on pop psych Kahneman-style points, it doesn’t seem very useful. It also uses typological thinking because it classifies people into 16 classes, clearly wrong-headed. It found my weakest side to be planning fallacy, but this isn’t actually the case because I’m pretty good at getting papers and projects done on time.
Update 2018-11-10
David Pinsen (who is a trader with skin in the game for prediction making) sent me an additional test to try: http://confidence.success-equation.com/. It follows the same approach as the confidence test with the US states, i.e. bunch of forced TRUE/FALSE questions and a question about certainty. My results were therefore unsurprisingly similar to before (close to perfect calibration) but somewhat overconfident this time (by 7%points). The test was too short for their number of options, they should have combined some of them. Annoyingly, they didn’t provide a Brier score, but I calculated it to be .20. It is surprisingly difficult to find guidelines for this metric, but in Superforecasters, a case story of given of a superforecaster (i.e. top predictor) called Doug. He had an initial score of .22 and was top #5 that year. However, this was calculated with the multi-class version of the formula (see FAQ), so his score was .11 on the scale I used. The average forecaster was .37 or 0.185 on the 0-1 scale. So, appears I did slightly worse than the average forecaster in Good Judgment Project. This result is probably pretty good considering that this is a self-selected group of people who spend a lot of time making forecasts based on any information they choose, while I didn’t use any help here just guessed based on whatever was in my head already. The test above provided a brier score as well, but gave it as a percentage. This might be a reversed version (i.e. (1-brier)*100), and if so, my new score would be 81.5% compared to 86.8 before%.
Note: the 60% point is based on n = 4 of which I got 1 right.