There’s a new meta-analysis out for brain size/volume and intelligence:
- Pietschnig, J., Gerdesmann, D., Zeiler, M., & Voracek, M. (2022). Of differing methods, disputed estimates and discordant interpretations: the meta-analytical multiverse of brain volume and IQ associations. Royal Society Open Science, 9(5), 211621.
Brain size and IQ are positively correlated. However, multiple meta-analyses have led to considerable differences in summary effect estimations, thus failing to provide a plausible effect estimate. Here we aim at resolving this issue by providing the largest meta-analysis and systematic review so far of the brain volume and IQ association (86 studies; 454 effect sizes from k = 194 independent samples; N = 26 000+) in three cognitive ability domains (full-scale, verbal, performance IQ). By means of competing meta-analytical approaches as well as combinatorial and specification curve analyses, we show that most reasonable estimates for the brain size and IQ link yield r-values in the mid-0.20s, with the most extreme specifications yielding rs of 0.10 and 0.37. Summary effects appeared to be somewhat inflated due to selective reporting, and cross-temporally decreasing effect sizes indicated a confounding decline effect, with three quarters of the summary effect estimations according to any reasonable specification not exceeding r = 0.26, thus contrasting effect sizes were observed in some prior related, but individual, meta-analytical specifications. Brain size and IQ associations yielded r = 0.24, with the strongest effects observed for more g-loaded tests and in healthy samples that generalize across participant sex and age bands.
The sample sizes are getting pretty massive these days. The main idea with this new meta-analysis, aside from having more studies/data, is to apply something called specification curve analysis (SCA). Why, what?:
It has been demonstrated that design and analytical choices as well as researcher degrees of freedom (decisions that are being made that affect e.g. the specification of inclusion criteria or the selected statistical approach) may lead to substantially varying results from meta-analyses although they are based on similar databases and examine identical research questions (see the multiverse and specification-curve approach to meta-analysis introduced by [14], adopting analogous approaches for primary data analysis, i.e. multiverse analysis, by [15], and specification-curve-analysis, by [16,17]). Typically, there are a variety of reasonable choices that need to be made in regard to any type of study (for an overview, see [18]) which different researchers may (dis)agree about. For meta-analyses in this context, it matters most which studies are included and how they are analysed [14].
Researchers typically have conceptual or methodological reasons to prefer certain specifications over others. However, other researchers may apply different but equally reasonable selection criteria and analysis approaches which necessarily will lead to different summary effect estimations. One prominent example of the effects that such differing methodological choices can have is the widely received but heavily criticized paper that seemingly showed larger death-tolls of hurricanes with female as opposed to those with male names [19] in the prestigious journal PNAS. Although the methodological choices of this study had been well-justified, they represented an extreme specification which represented a single possibility out of a total of 1728 reasonable specifications (i.e. based on a number of published opinions about how these data should have been analyzed) to analyze these data (i.e. under the assumption that all possible meaningful kinds of data to analyze and how to do it had been identified in this study), only 37 of which (i.e. 2.1%) would have led to significantly deadlier hurricanes with female names [16,17].
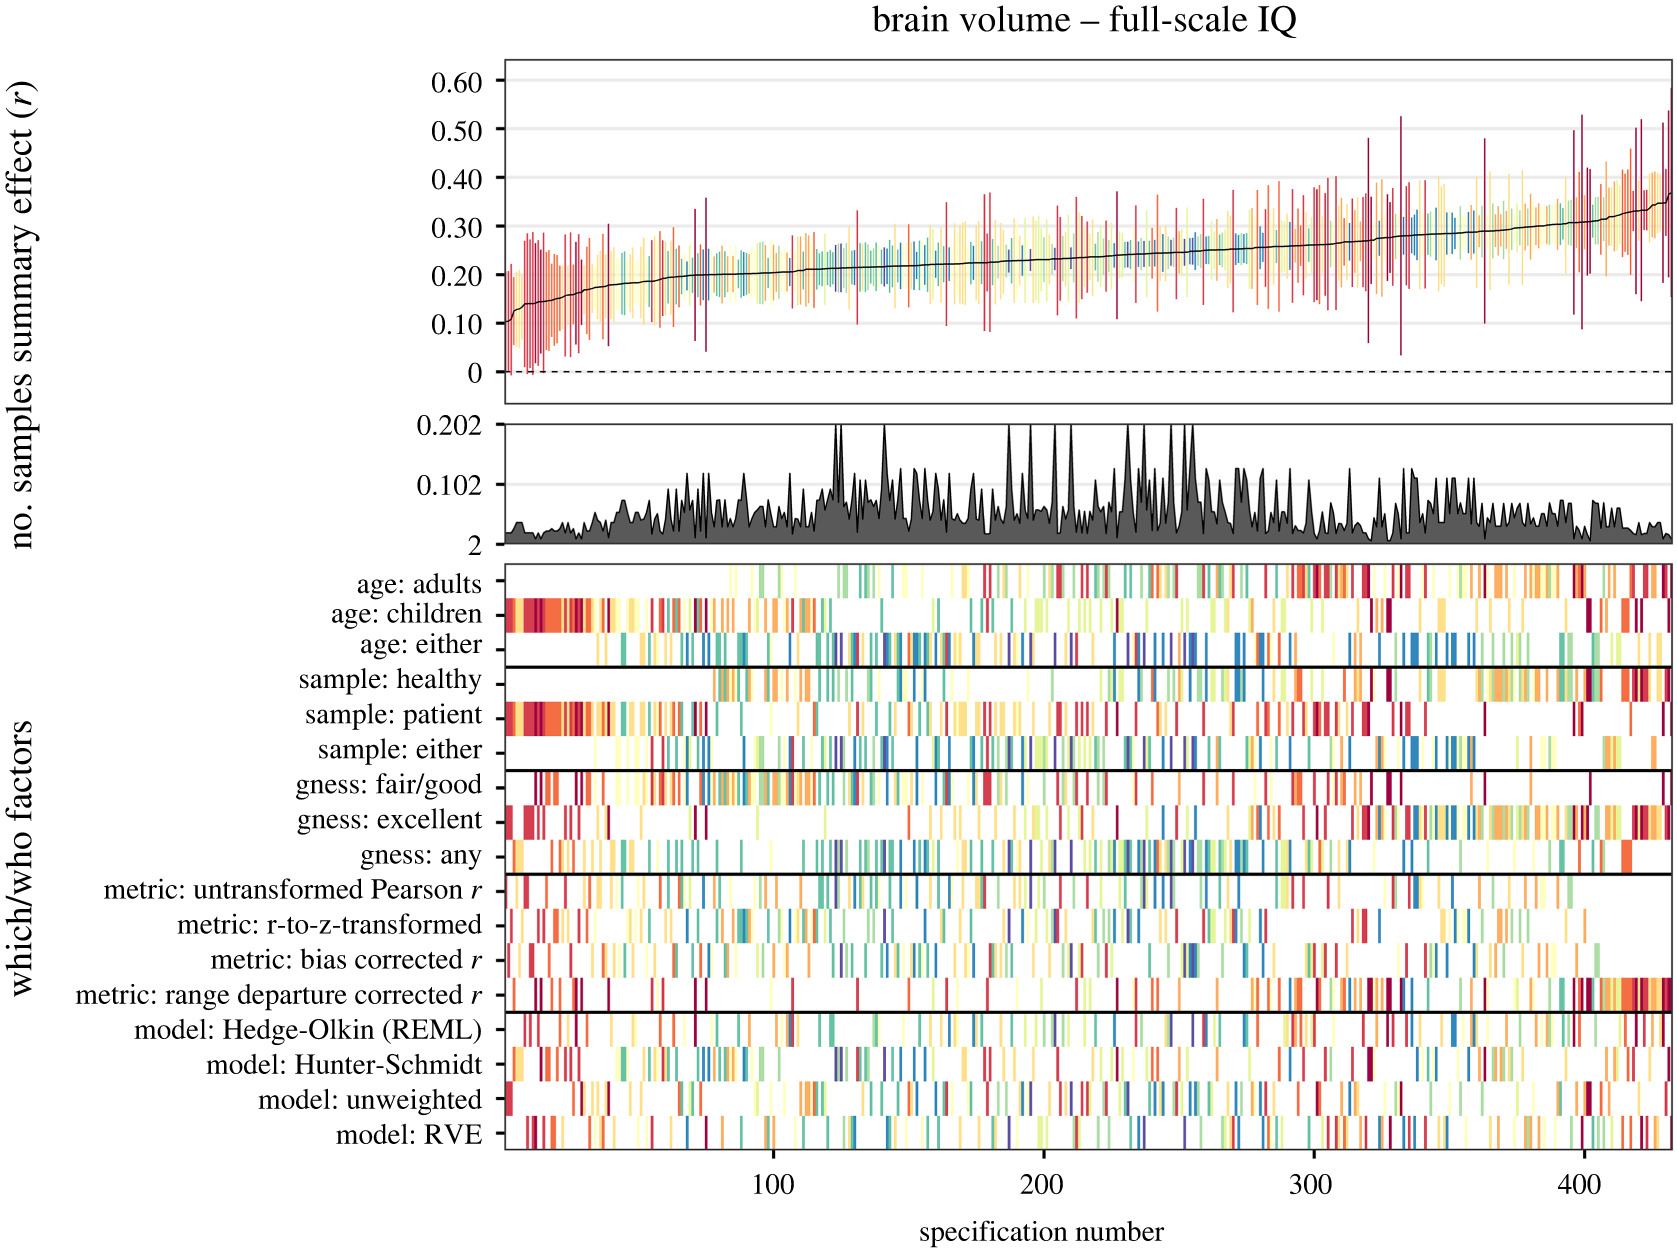
Analyzing the same data making different decisions yields different results, sometimes starkly so. I covered this before in a post on different research teams analyzing the same dataset for the same hypotheses. The idea of SCA then is mimic this many-teams approach. A single team will pretend it is many teams by trying a lot of different choices and checking out how they affected the results. That’s what this new meta-analysis is really about. There’s a lot of choices, so there’s a lot of results. Like a lot a lot:
Consequently, 2123 and 271 (about 10 undecillions and 2 undecillions) combinations were possible for an exhaustive selection of full-scale IQ subsets for healthy and patient samples, respectively (270 and 245 as well as 249 and 233 combinations were possible for verbal and performance IQ). For our analyses, we randomly drew 100 000 subsets out of these possible combinations to illustrate outlier influences in GOSH plots (Graphic Display of Heterogeneity). Specifically, GOSH plots allow a visual inspection of summary effect distributions and their associated between-studies heterogeneity when any kind of (un)reasonable specification has been used. Moreover, numerical inspections of dispersion values (e.g. interquartile ranges) and the effect distribution permit an evaluation of the influence of moderating variables (i.e. narrow intervals and symmetrical distributions indicated well-interpretable summary effects).
The overall quantitative results are not very different though from the other meta-analyses:
A summary effect of r = 0.23 for full-scale IQ was observed (k = 194; I2 = 60.70; 95% CI [0.21; 0.26]), when all available independent effect sizes were synthesized by means of the Hedges & Olkin approach. Summary effects were somewhat smaller when associations were limited to verbal (r = 0.20; k = 115; I2 = 43.84; 95% CI [0.16; 0.23]) or performance IQ domains (r = 0.20; k = 82; I2 = 27.66; 95% CI [0.17; 0.24]).
The Hunter & Schmidt-typed synthesis of artefact-corrected coefficients was broadly consistent with the results of the Hedges & Olkin approach, but unsurprisingly yielded somewhat larger effects for full-scale (r = 0.26; k = 116; I2 = 61.28; 95% CI [0.21; 0.031]), verbal (r = 0.22; k = 50; I2 = 50.28; 95% CI [0.15; 0.29]) and performance IQ (r = 0.25; k = 45; I2 = 30.42; 95% CI [0.20; 0.31]). Of note, these analyses were based on fewer observations compared to the other approaches, because necessary information for corrections (e.g. within-sample standard deviations of IQ scores) had not been reported. Results from the robust variance estimation-based approach were virtually identical with the Hedges & Olkin analyses showing small-to-moderate associations for full-scale (r = 0.23; k = 203; I2 = 54.85; 95% CI [0.20; 0.25]), verbal (r = 0.21; k = 141; I2 = 48.34; 95% CI [0.18; 0.24]) and performance IQ (r = 0.21; k = 110; I2 = 32.41; 95% CI [0.18; 0.24]).
Note the contrast between the standard approach (H&O) and the psychometric meta-analysis (H&S; PMA) which corrects for some downward biases (range restriction, measurement error, construct invalidity, dichotomization/discretization bias). The issue with meta-analysis is that we know there are some biases that inflate associations and some that deflate them. They are both at play, and may be hard to simultaneously correct for. The Hunter-Schmidt approach adjusts for the deflationary biases, which obscure the generality of results. This guards against false positives about moderators (interactions). The standard approach ignores these deflationary errors but attempts to detect for inflationary biases, especially publication bias. As the early studies were done back in the 1990s with tiny samples using expensive MRI data, we should expect quite a bit of publication bias for these initial studies. Modern studies with large sample sizes probably don’t have much publication bias.
The results are somewhat hard to summarize because the authors did too many rather pointless subgroup analyses. I don’t know why we are particularly interested in results verbal IQ vs. performance IQ in addition to overall IQ. After all, these are all trying to estimate g, just that the subtypes are less accurate in doing this. (And one cannot really contrast verbal vs. nonverbal IQ to examine tilt effects as these are too highly saturated with g.) The funnel plot shows the existence of publication bias:

Their various formal tests and corrections for this bias yielded mixed results. Trim and fill resulted in a corrected estimate of r = .21. The issue with such corrections is that, first, they don’t work very well, and second, if small samples are higher quality than larger samples (due to costs of doing a study), this would lead to incorrect adjustments for bias. The distribution of results across all their many method variations produced this figure:
A value of .29 was obtained using the Hunter and Schmidt approach for healthy samples. This does not adjust for publication bias, but otherwise it adjusts for the known deflationary biases, and the use of healthy samples probably avoids some bias from clinical samples. I would thus take this as the best overall estimate if we subtracted a bit for publication bias, say, 0.26.
Do we have an independent validation somehow? A large preregistered study with good methods? We do, and they cite it, but did not discuss it, which I find very weird. Here it is:
- Cox, S. R., Ritchie, S. J., Fawns-Ritchie, C., Tucker-Drob, E. M., & Deary, I. J. (2019). Structural brain imaging correlates of general intelligence in UK Biobank. Intelligence, 76, 101376.
The associations between indices of brain structure and measured intelligence are unclear. This is partly because the evidence to-date comes from mostly small and heterogeneous studies. Here, we report brain structure-intelligence associations on a large sample from the UK Biobank study. The overall N = 29,004, with N = 18,426 participants providing both brain MRI and at least one cognitive test, and a complete four-test battery with MRI data available in a minimum N = 7201, depending upon the MRI measure. Participants’ age range was 44–81 years (M = 63.13, SD = 7.48). A general factor of intelligence (g) was derived from four varied cognitive tests, accounting for one third of the variance in the cognitive test scores. The association between (age- and sex- corrected) total brain volume and a latent factor of general intelligence is r = 0.276, 95% C.I. = [0.252, 0.300]. A model that incorporated multiple global measures of grey and white matter macro- and microstructure accounted for more than double the g variance in older participants compared to those in middle-age (13.6% and 5. 4%, respectively). There were no sex differences in the magnitude of associations between g and total brain volume or other global aspects of brain structure. The largest brain regional correlates of g were volumes of the insula, frontal, anterior/superior and medial temporal, posterior and paracingulate, lateral occipital cortices, thalamic volume, and the white matter microstructure of thalamic and association fibres, and of the forceps minor. Many of these regions exhibited unique contributions to intelligence, and showed highly stable out of sample prediction.
This is the single best study on the topic with a massive sample size of 7201 adult general population subjects. They used a SEM to avoid random measurement error, and that produced a standardized beta of .276, which is about the same thing as a correlation. This value does not have any publication bias since it was pre-registered (and not based on p values anyway). It does have a few smaller negative biases. First, the sample in the UKBB is somewhat unrepresentative due to recruitment biases and mortality bias, so the results need a bit of range restriction adjustment. Second, the tests in the UKBB are quite poor. Using SEM will adjust for random measurement error, which is very important here, but it will not adjust for not sampling a sufficiently wide diversity of cognitive tests. To measure g perfectly, one has to sample a varied sample of tests. Insofar as one does not do this, the g factor of a given study will have some construct invalidity, which will also negatively bias results. I don’t know how large this bias would be in UKBB, but I don’t imagine it would be very large. Taking the two residual biases together, probably the true correlation will be about .30. The meta-analysis produced a value quite close to this when it adjusted for random measurement error, r = .29. The agreement is thus very high, and this value cannot be much doubted going forward. (There is some cheating as the Cox study contributed data towards that value, but the authors reported that leaving-one-out analysis did not really find much influence of single studies.)
From a scientific perspective, the results are not surprising at all. Human brain size sky-rocketed in size at the same time humans evolved complex behavior. Animal studies show that (relatively) brain size relates to intelligence as measured in diverse ways. Brains are hugely expensive, so evolution wouldn’t produce them unless compelled. From these obvious reasons, we already knew that brain size must be related to intelligence in humans. From a broader historical-political perspective, the results are interesting because we’ve had decades and decades of socialist denial of this fact. Liars like openly Marxist Stephen Jay Gould went out of their way to try to disprove the claim:
The obsession with brain size continued well into the twentieth century. Both Lenin’s and Einstein’s brains were taken for study after death. Lenin’s had an entire institute of brain research founded for its study; years of work could find nothing unusual about the brain, but the institute remains as a major research center. The point is that there are no sensible questions that neuroanatomy can address to the dead brain of however distinguished a scientist or politician.” There is virtually no observable relationship between the size or structure of an individual brain measured after death and any aspect of the intellectual performance of its owner measured during life. There are exceptions: In cases of specific brain damage due to illness, lesions, or tumors, or the brain shrinkage of senile dementia or alcoholism, though even here there are counterexamples.15 But in general, once the effects of height, age, etc. have been allowed for, brain weight is related to body size. The search for the seat of differences in performance between individuals must move beyond the simple examination of brain structures. Despite this, there remains a common assumption that there is a relationship between large heads and high brows and intelligence, an assumption that was made the basis of a criminological theory of types by the Italian Cesare Lombroso in the late nineteenth century. According to Lombroso, in an extension of the phrenological theorizing of the early part of the century, criminals could be identified by certain basic physiological features: *
[quote from Lombroso omitted]
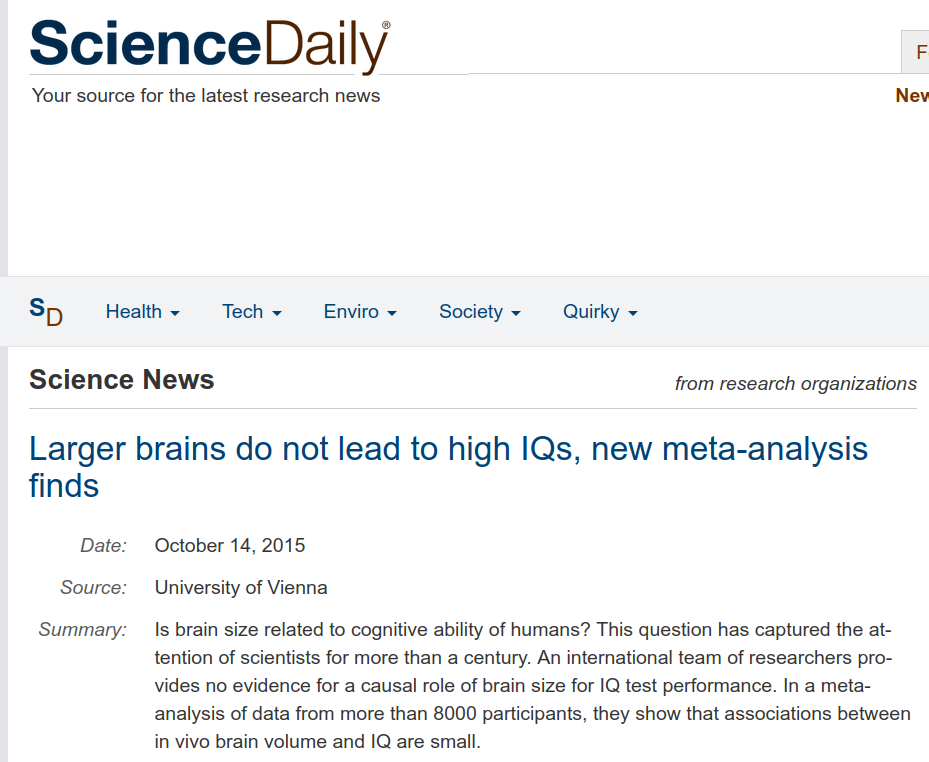
The media has its role to play too. For instance, the last time a brain size and intelligence meta-analysis was published — 2015 by the same author — various media were citing it as actually disproving such a link, despite the study actually finding it!

Note the contradiction between headline and the summary:

Back in 2013, same headline, different study:

One could probably find many more of these. It would be informative to do a poll of journalists compared to laymen. One might suspect that journalists are less informed than laypersons. It is well known that journalists distort intelligence research and that they are quite left-leaning.
Back to the science. The real correlation of brain size and intelligence is probably about .30. So what explains the rest of the differences? Using the usually misleading conversion, we know that r = .30 means about 10% of variance, so there’s 90% left to explain. It will be a lot of more fine-grained stuff. There’s quite a few studies that have used multi-modal MRI data to predict intelligence and they reach accuracies above r = .30, some non-Western researchers even implausibly claiming values into the .70s. The 2015 study by Stuart Ritchie is credible, and they got about 20% variance, so a correlation of about .45. We need to do better! I bet that we will get to r = .90 within 2 decades, meaning that MRI would be about as good as giving people a good intelligence test, but a much cleaner approach. Presumably MRI prices will fall, so this approach may become competitive instead of standardized tests for recruitment. The MRI data collection only has to be done once, and then one can simply submit that along with the CV.