Whenever race differences in cognitive ability broadly speaking are brought up, they encounter huge skeptical and emotional opposition. This is understandable, though not grounded in science. One common claim is to say that the tests are not measuring correctly, that is, that the observed race gaps on some test or another are due to test bias. Arthur Jensen dealt exhaustively with this in 1980 in his 700+ page book Bias in Mental Testing. This caused various other researchers to produce similar reviews in the following years, which largely agreed with him (one of them amusingly titled Bias in mental testing since Bias in Mental Testing). These reviews were largely based on statistical evidence regarding the measurement properties (internal validity such as factor loadings) and predictive validity (do tests predict outcomes the same way?). Another way to approach the question is to look for tests that cannot credibly be said to be culturally biased in whatever way. Fortunately, in a different tradition of research, which also originated with Francis Galton (in its modern form, the first research was done in astronomy, believe it or not), there is the study of simple tests where completion is measured in time and accuracy. Since the tests typically involve just pressing a button in response to one or more lights, it is difficult to come up with some half-plausible theory of how they could be biased. The most studied of these very simple tests (sometimes called ECTs, elementary cognitive tasks) is simple reaction time. The test just consists of having some kind of button the subject has to press as quickly as possible following some visual or auditory cue (light/sound). The time between the stimulus and the press is then measured (in ms). This trial is repeated a number of times so that one is able to calculate reliable summary statistics for a given individual (that is, to summarize their personal distribution of reaction times). The specific test can also be made more complicated. A very common variant is to have multiple buttons only one of which lights up and must be pressed (choice reaction time). This research was done using various apparatuses such as the Jensen box:
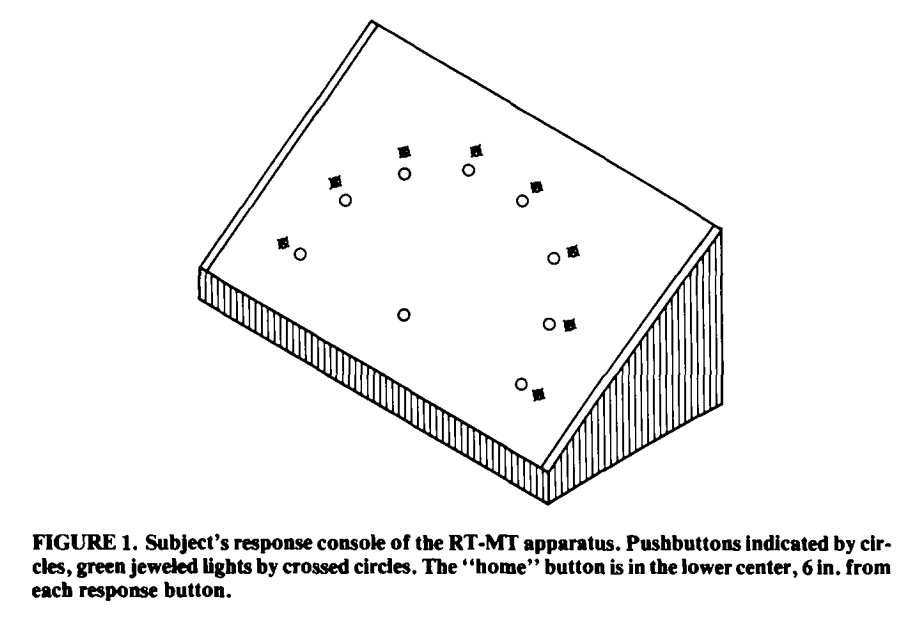
A number of researchers have used these simple tests to examine various race differences. Lynn & Holmshaw 1990 reported these findings from South Africa:
Similarly, Lynn et al 1991 reported gaps in favor of Chinese (Hong Kong) over British:
239 British and 118 Chinese Hong Kong nine-year-old children, each representative for intelligence of Britain and Hong Kong, were tested on the Standard Progressive Matrices and on reaction times. The reaction time apparatus measured simple and complex reaction times proper (i.e., decision times), movement times, and variabilities. The results showed that all the reaction time measures were associated with intelligence and that Hong Kong children had a higher mean IQ and faster reaction times than British children. This suggests that the difference in mean IQ between Hong Kong and British children has a neurological basis. However, the British children showed faster movement times and lower variabilities, contrary to expectation. This suggests independent neurological processes may underlie reaction times, movement times, and variabilities.
And Lynn & Shigehisa 1991 (2nd study) reported that the Japanese also outperformed the British:
Japanese and British 9-year-old children were compared on the standard progressive matrices and twelve reaction time parameters providing measures of simple and complex decision times, movement times and variabilities. The mean of the Japanese children on the progressive matrices exceeded that of the British children by 0.65 SD units and on the decision times component of reaction times by 0.50 SD units, suggesting that the high Japanese mean on psychometric intelligence is largely explicable in terms of the more efficient processing of information at the neurological level. Japanese children also showed faster movement times but, contrary to expectation, had greater variabilities than British children.
The hypothesis that reaction times are positively associated with intelligence was tested on 444 nine-year-old Japanese children. Intelligence was measured by the Raven’s Standard Progressive Matrices, and 12 reaction time parameters were obtained to give measures of movement times, reaction times proper (decision times), differentiated into simple and complex reaction times, and variabilities. Factor analysis of the reaction time tasks indicated the presence of a general factor and three primary factors identifiable as movement times, simple reaction times, and complex reaction times. Of these, only complex reaction times showed significant associations with intelligence.
And it’s not just Lynn. Sen & Jensen 1983 reported that Americans outperformed Indians. Jensen & Whang 1993 examined White and Chinese Americans and found the Chinese did better.
Common to all the above studies is that they relied on various convenience samples, not large representative samples. Given the consistency of the results, we aren’t really in doubt that the larger representative samples would replicate the patterns, but nevertheless, it is good to know for sure. I recently found that there is reaction time data from the simplest version available in the NHANES III (1988-1994), a large representative American sample of older people. NHANES in general are a goldmine because they are completely public and have many interesting variables. Unfortunately, the older datasets are only available in the obnoxious fixed-width data format that was commonly used for recording data on tapes (as it is very compact). Modern AIs have made accessing and using this data much easier, so now I can quickly do an analysis that would otherwise have taken many hours. In the dataset, subjects took the simple reaction time test 50 times, so each person has 50 values available. The distribution of which can look like this:
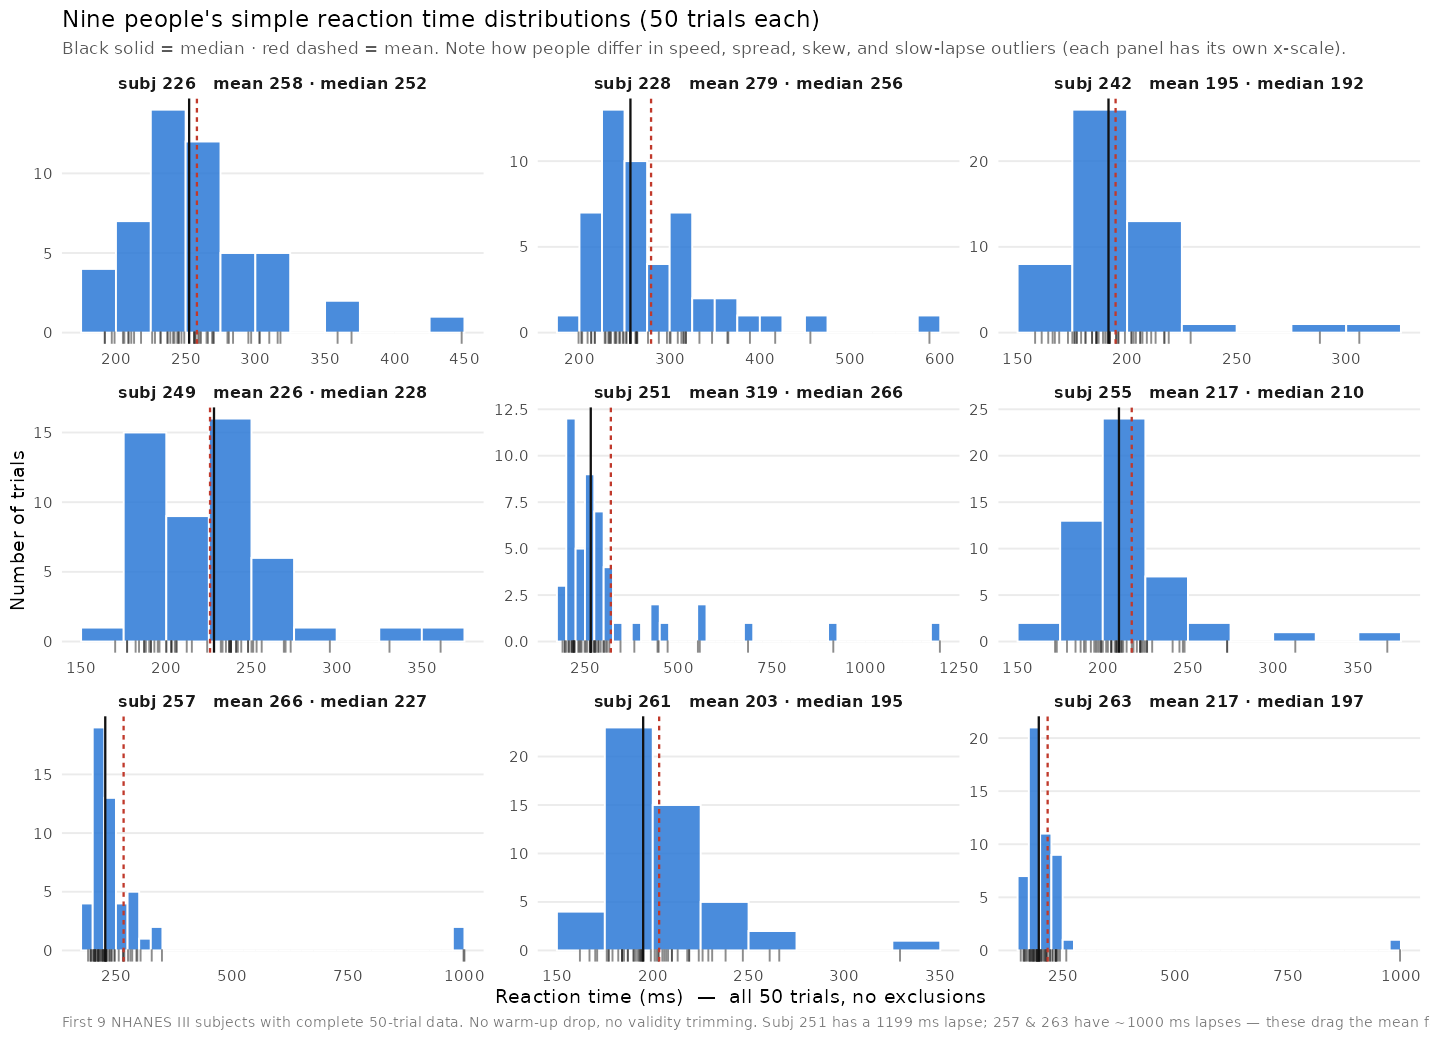
These are from the first 9 subjects with data (only adult subjects took the reaction times as part of medical examination). Note the shapes of the distributions differ, and the presence of outliers (3 subjects have inattentive trials at 1000+ ms). There is also a learning effect, which we can see if we plot reaction times as a function of trial count:
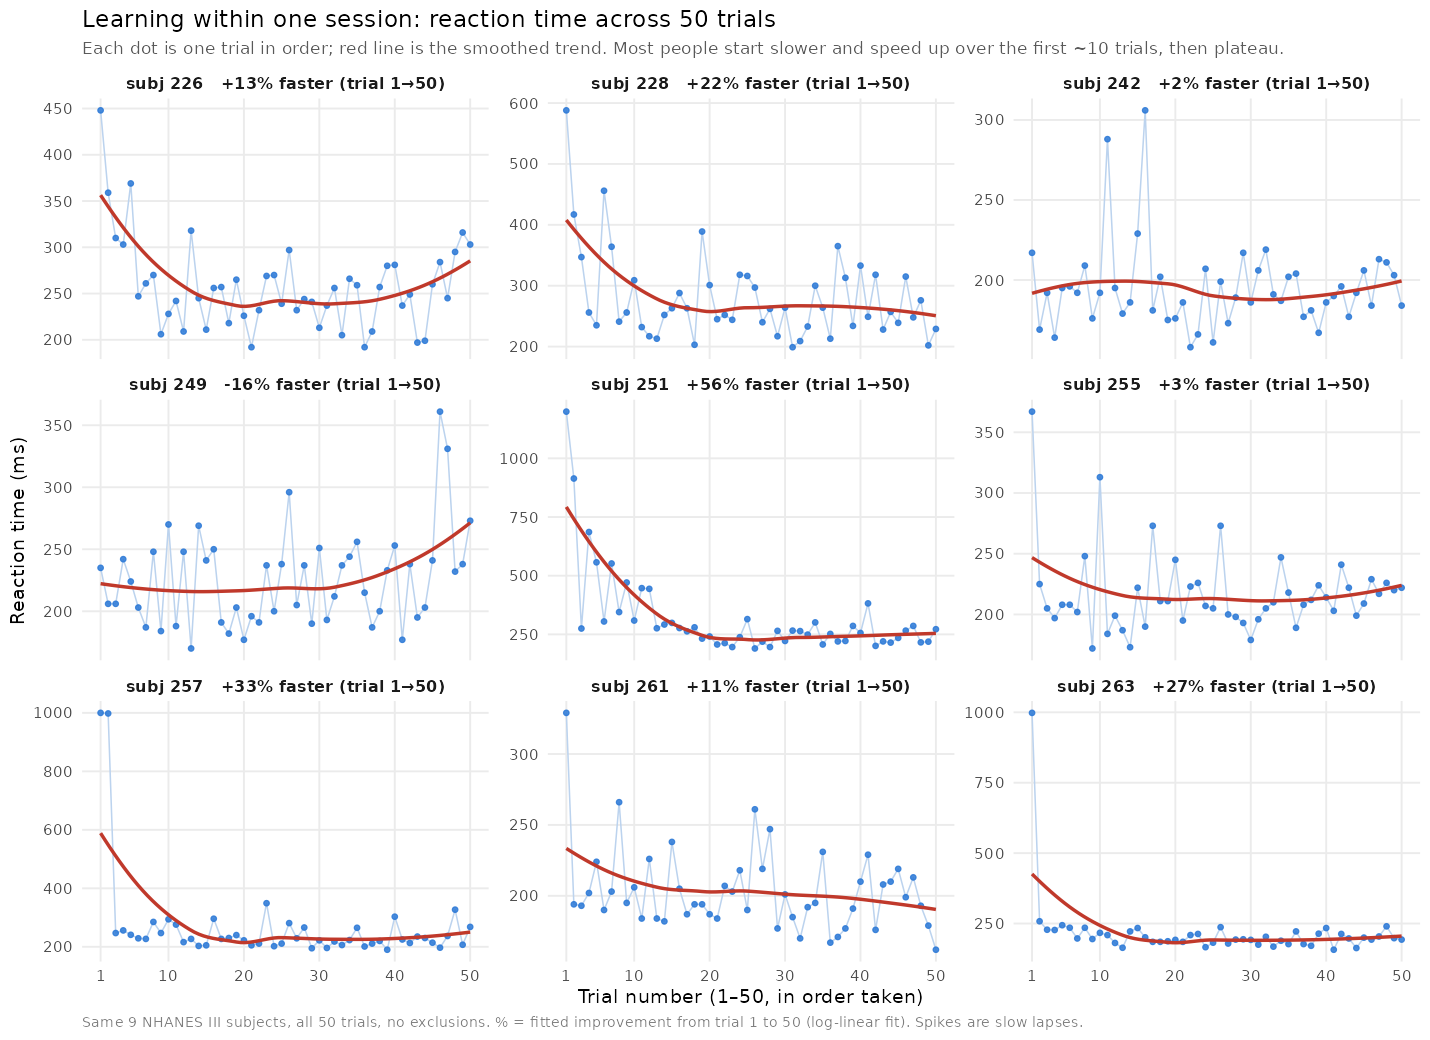
Most subjects get better with practice, but some appear to get tired or bored towards the end. One could fit individual learning rate models to the data, but from the data you can see that these models would give rather nonsensical results in many cases. Bottom left subject appears to be learning if one looks at the red line fit, but not really, just their first trial was extremely slow.
Most of the studies above reported various summary statistics by race. The analytic choices are actually nontrivial because we have 2 decisions to make regarding summary statistics to use: 1) within-person, and 2) between-person. For within person, I can think of a number of options depending on what we care most about. It is known that the dispersion (variability) of the distribution is itself indicative of cognitive ability. The presence of severe outliers means we should also explore robust statistics, or use exclusion rules. I’ve opted for the simplest approach of including all data, so if subjects were inattentive at first, or bored at the end, this is part of their real performance, just like they might be inattentive or bored when driving a car. For the choice of summarizing between-persons, I’ve used the mean. We can judge to which extent that is sensible by looking at the distributions of the various within-person metrics by race:
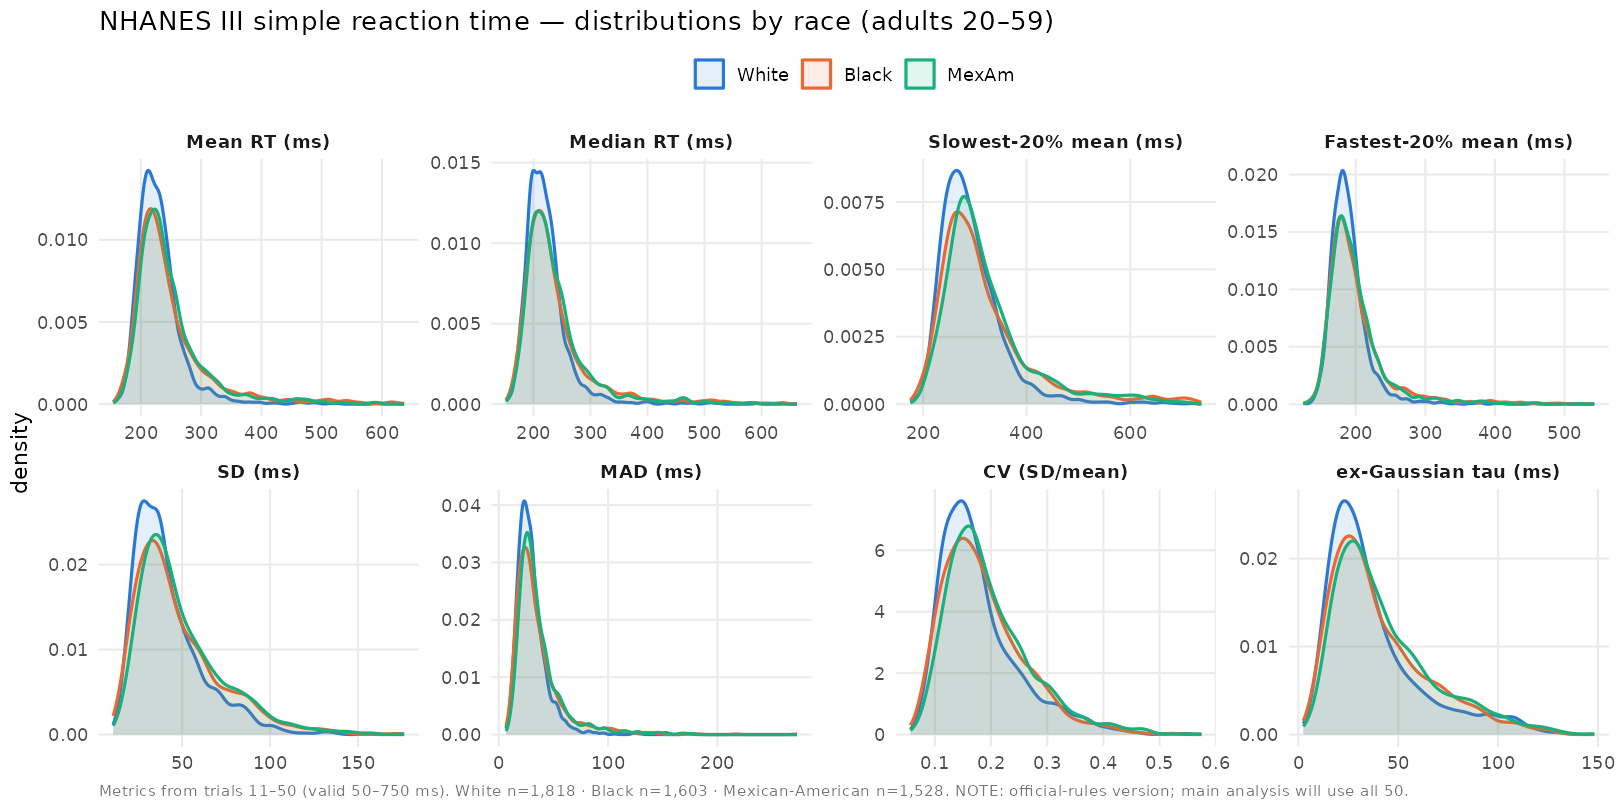
All the between-person distributions have the same kind of right tail as they do within person. Thus, using the mean is somewhat misleading. The distribution doesn’t appear to differ in shape by race however. In every case, the Whites (European Americans) do better, which we can see (barely) by the blue lines being taller and towards the left (more clustered at faster reaction times). If we nevertheless use the means to summarize the distributions, we can calculate the familiar Cohen’s d gaps here in terms of the White between-person SD for consistency. In general, Cohen’s ds are calculated using average SDs or occasionally using the total sample SD. The latter is more inappropriate as the presence of ethnic diversity increases the total sample SD and reduces any Cohen d gap sizes (for instance, Wechsler’s SD are based on total sample SDs, so their IQ gaps shrink as the norm sample becomes less White over cohorts resulting in a phantom gap narrowing). However, to keep things most consistent, I’ve long decided to report all Cohen’s d’s using the White SD, so that the reference population stays the most consistent between samples and studies. With that said, here are the gaps on these metrics:
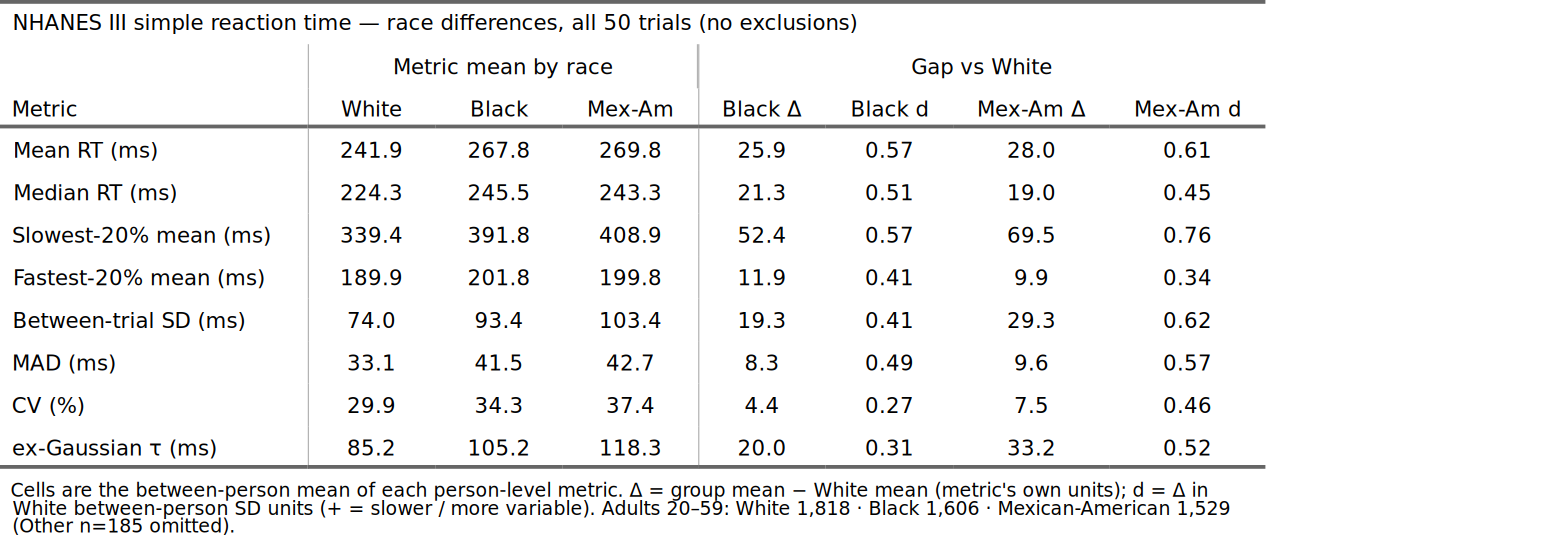
So despite the data being somewhat irregular, it doesn’t matter too much whether we try to deal with this or not. The Black-White d gaps are 0.57 for a mean, 0.51 for the median, 0.57 for the mean of the slowest 20% trials, 0.41 d for the fastest, 0.41 for the standard deviation (SD), 0.49 for the robust version (MAD), and about 0.30 d for 2 other metrics. The Mexican-White results tell a similar story.
Finally, though the samples were pretty representative, we can adjust for age and sex, the Whites were older, which goes against them slightly, and there is even a temperature measurement of the room, which turns out to be surprisingly important:
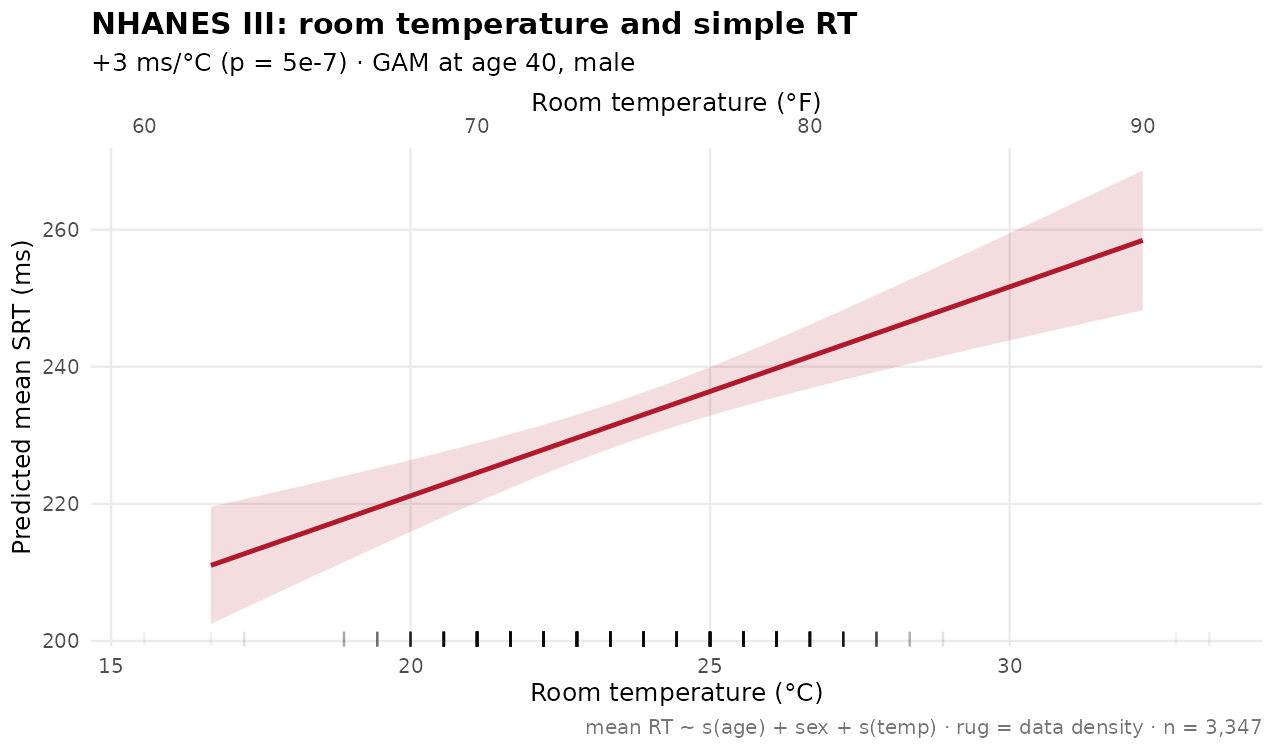
Taking into account these factors (lest someone claims that maybe the non-Whites did poorly because of lack of AC communism), we can use this model: metric(RT) ~ race + spline(age) + sex + room_temp. This gives us these results:
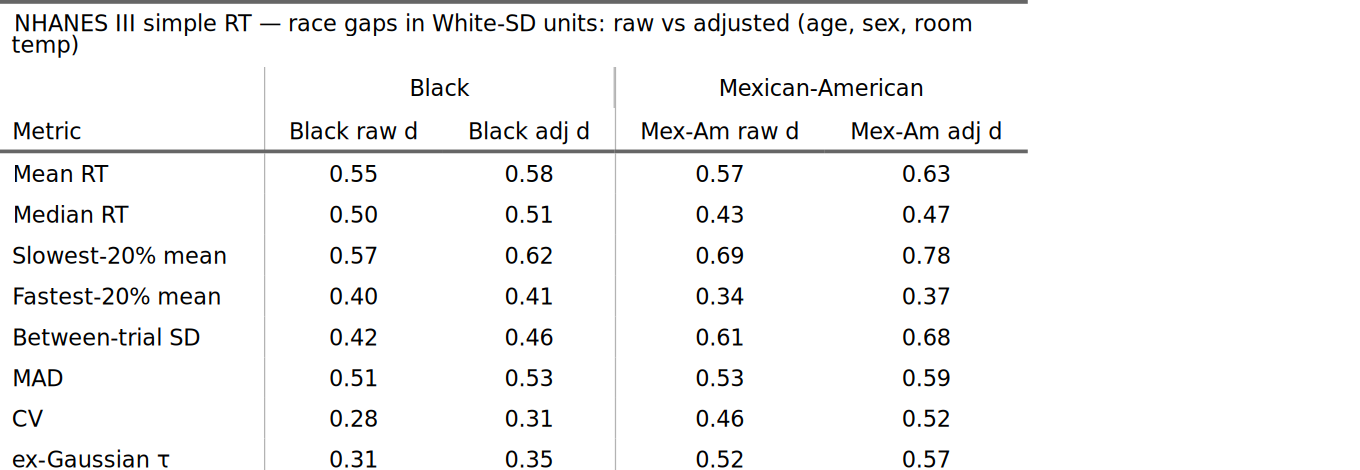
So in line with slight age confounding (Whites are older and older people are worse), the gaps are somewhat larger after the adjustment. In general, it made little difference.
Finally, NHANES 3 administered a number of other tests, though not to each age group, but we can still compute the Cohen’s d gaps for each test:
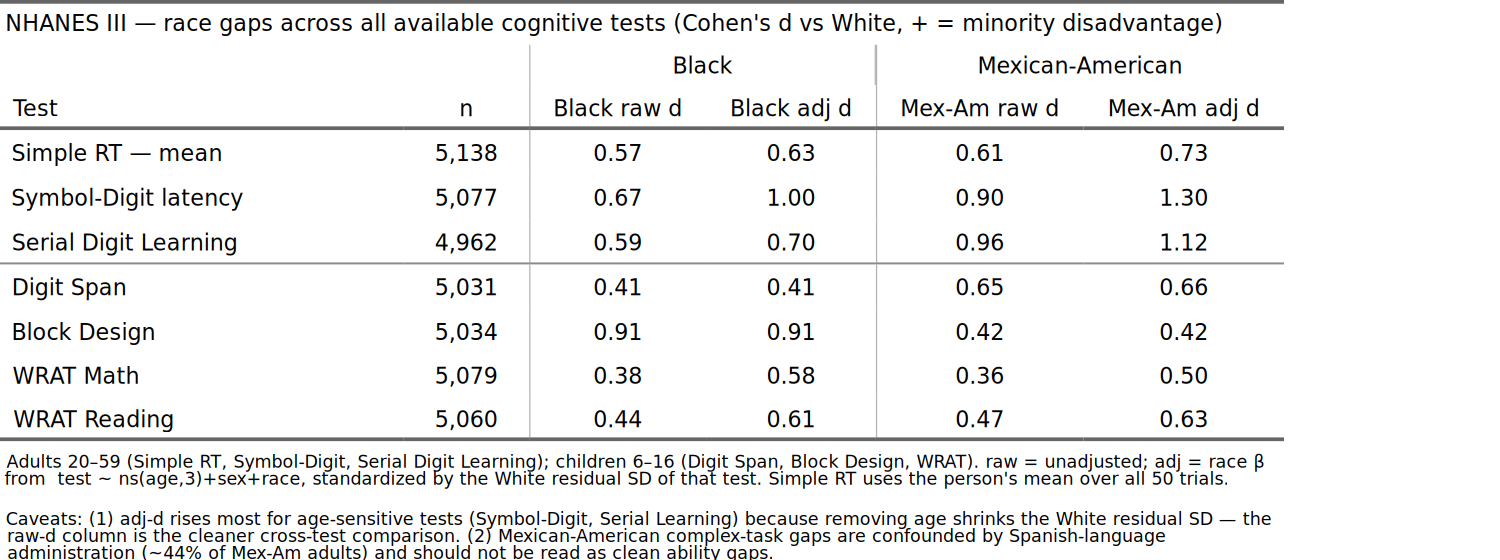
The other tests also show sensible gap sizes, some of them even exceeding 1.0 d. This is somewhat suspicious, but for the Mexicans, it probably has to do with language. NHANES has a question for administration language (recall, this is in the 1980s), so we can split by English vs. Spanish:
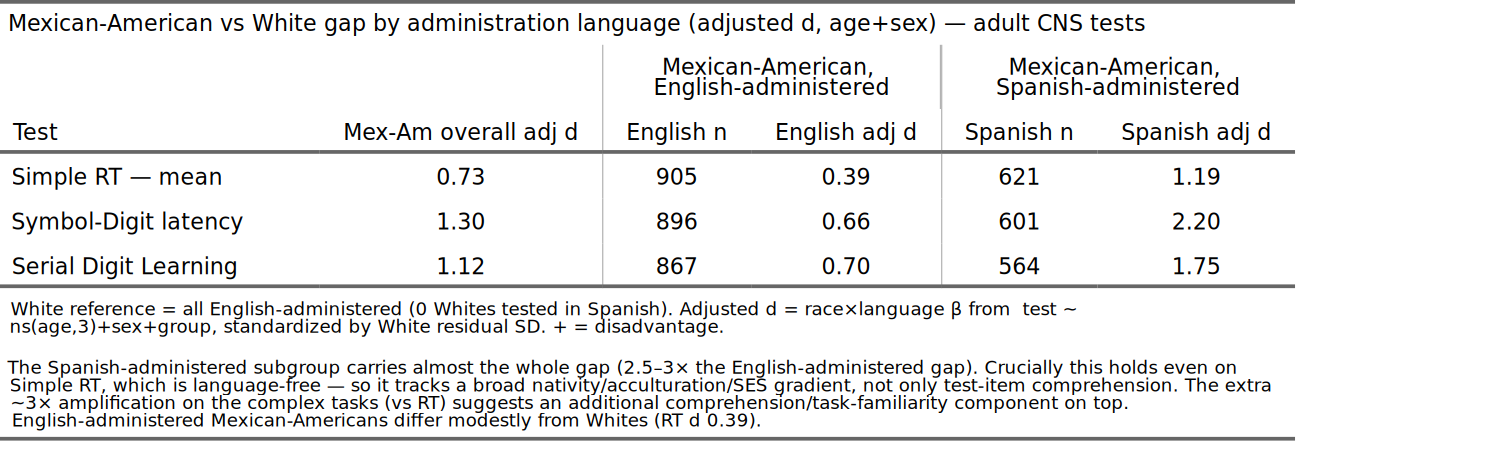
The results somehow make less sense than before. The gaps on reaction time are also much larger when using Spanish as administration language, even though language cannot affect performance on a simple reaction time test. This thus suggests that Spanish language is more a proxy for something else that is going on here. This oddity aside, overall, the results were normal for the reaction time gaps in general. The R notebook is available here.