I have written a couple of times about how to measure intelligence well and in a short time. Mainly I was interested in which single type of item is best in terms of how much information you can get per time. There is another aspect to measuring intelligence, which is that to measure intelligence well, you need to use multiple different kinds of items. This is because every item (or test of items) measures intelligence in addition to one or more other abilities. A vocabulary question measures intelligence, yes, but it also measures your general verbal skills, how you read, your long-term memory etc. Since the other abilities don’t tend to predict outcomes as well as intelligence (g) does, you generally want to minimize this non-g variance to predict the best. To do this, you need multiple different item types so that differences in the non-g abilities average out.
One test that has taken this principle as a design feature is the Wonderlic test. It takes 12 minutes to take, and in that time subjects have to solve as many of 50 relatively simple tasks of varying nature as possible. Here’s some sample items I found online:
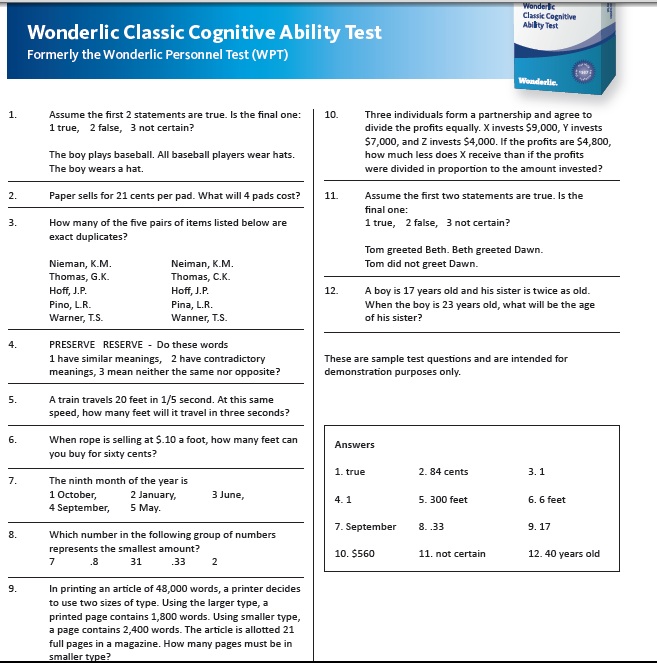
Considering that it only takes 12 minutes, one might wonder how useful it really is. A new meta-analysis cover just this question:
- Robie, C., Rasheed, S., Risavy, S., & Steel, P. (2024). A Meta-Analysis of the Relationship Between Wonderlic Test Scores and School Success.
This meta-analysis examined the validity of an alternative to traditional assessments called the Wonderlic which is a brief measure of general mental ability. Our results showed significant, positive correlations between Wonderlic scores and academic performance in general (r̅ = .26), between Wonderlic scores and undergraduate GPA in particular (r̅ = .27, ¯ρ = .33), and between Wonderlic scores and retention (r̅ =.09, ¯ρ = .12). We also identified several significant moderators of the relationship between Wonderlic scores and relevant outcomes (e.g., test publisher reported coefficients were larger than those reported by other sources). Subgroup differences in test scores were in the same range as other post-secondary admissions assessments (e.g., ACT and SAT scores). Overall, the Wonderlic has similar levels of subgroup differences and is less strongly related to GPAs than traditional assessments but still retains useful levels of predictiveness and is a shorter, less expensive assessment that requires less preparation than the ACT or SAT.
It is a little unclear from the abstract, but they only relied on student samples and predicted university outcomes:
Paper titles and abstracts were initially screened by one co-author to ensure that they: (1) included a student sample, (2) had correlations of the Wonderlic with academic performance, gender, or race, (3) used one of the following versions of the test: WPT, WPT-Q, SLE, or SLE-Q , (4) were written in English, and (5) did not focus on specialized samples with reported psychological impairment (e.g., attention deficit disorder) . After title screening, we were left with 224 potentially codable articles.
In terms of predicting academic performance and retention (not dropping out), they find:
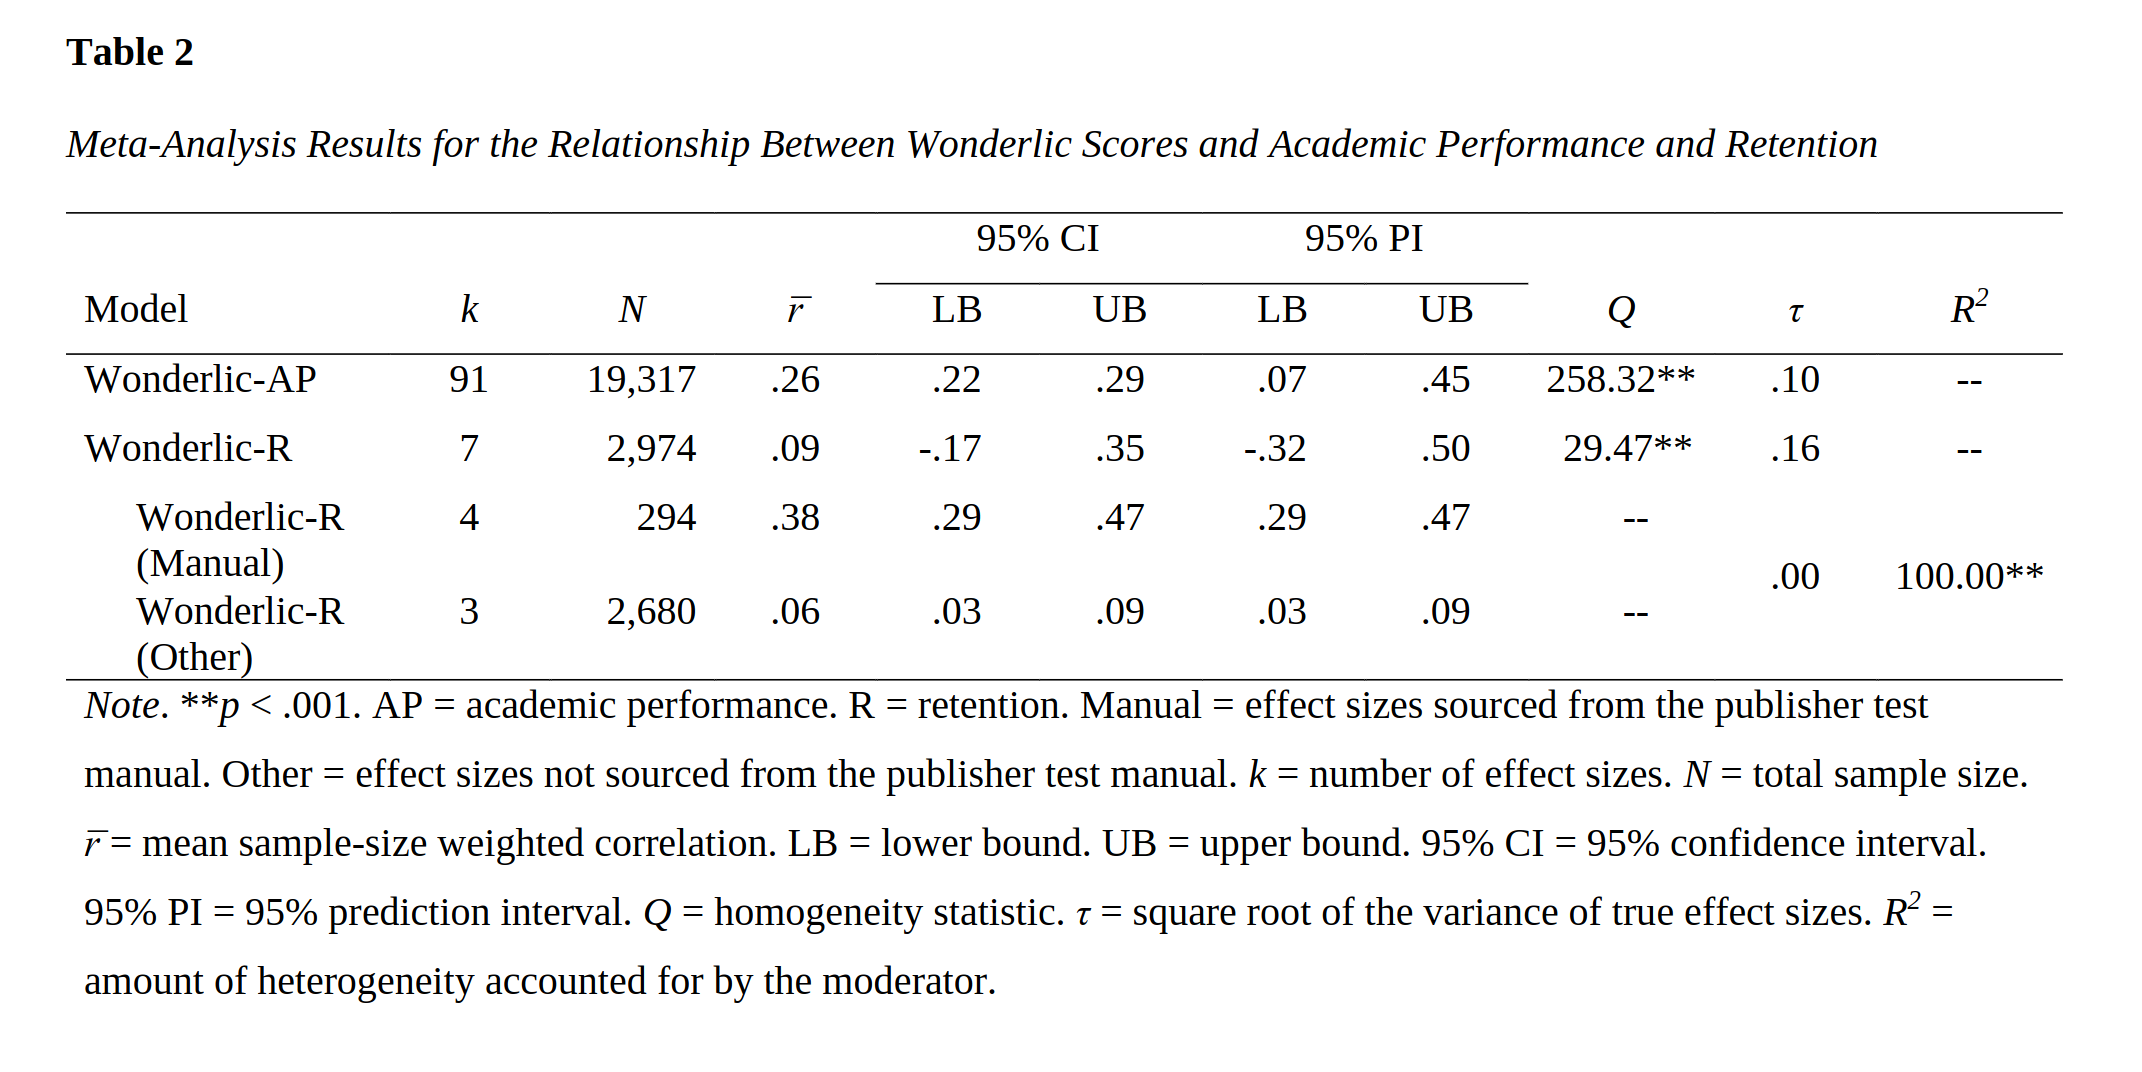
Overall, the correlation is not impressive but alright, 0.26. This is the observed mean correlation. We know this is biased downwards due to selection bias (range restriction) and the unreliability of the test. The authors also present the range restriction corrected results using the Hunter Schmidt method:

Now the correlation is 0.33. The difference between the two results is that they are answering two different research questions:
- What is the correlation between Wonderlic score and academic performance (GPA) in the student population? r = 0.26.
- What is the correlation between Wonderlic score and academic performance (GPA) in the student population if everybody went to university? r = 0.33.
They didn’t adjust for reliability because:
Corrections for unreliability in the predictor were not utilized because we were interested in the operational validity of the Wonderlic.
However, in their footnote, they report that:
We did however extract a distribution of Wonderlic reliabilities from the literature which is required to correct for indirect range restriction using the Case IV method (see Caretta & Ree, 2022). The mean and variance of this distribution was 0.85 and 0.004, respectively.
Though making reliability and range corrections at the same time is a bit complicated in the Hunter Schmidt meta-analysis approach, but roughly, this would mean the true correlations would be r_true = r_est / sqrt(.85), that is, 0.28 and 0.36. (In the HS method, as I recall, reliability corrections have to be done somewhat differently than the usual Spearman correction.)
To note, it seems the retention rate results from the test manuals are inflated, perhaps because of bias on part of the developer. They provide the plot:
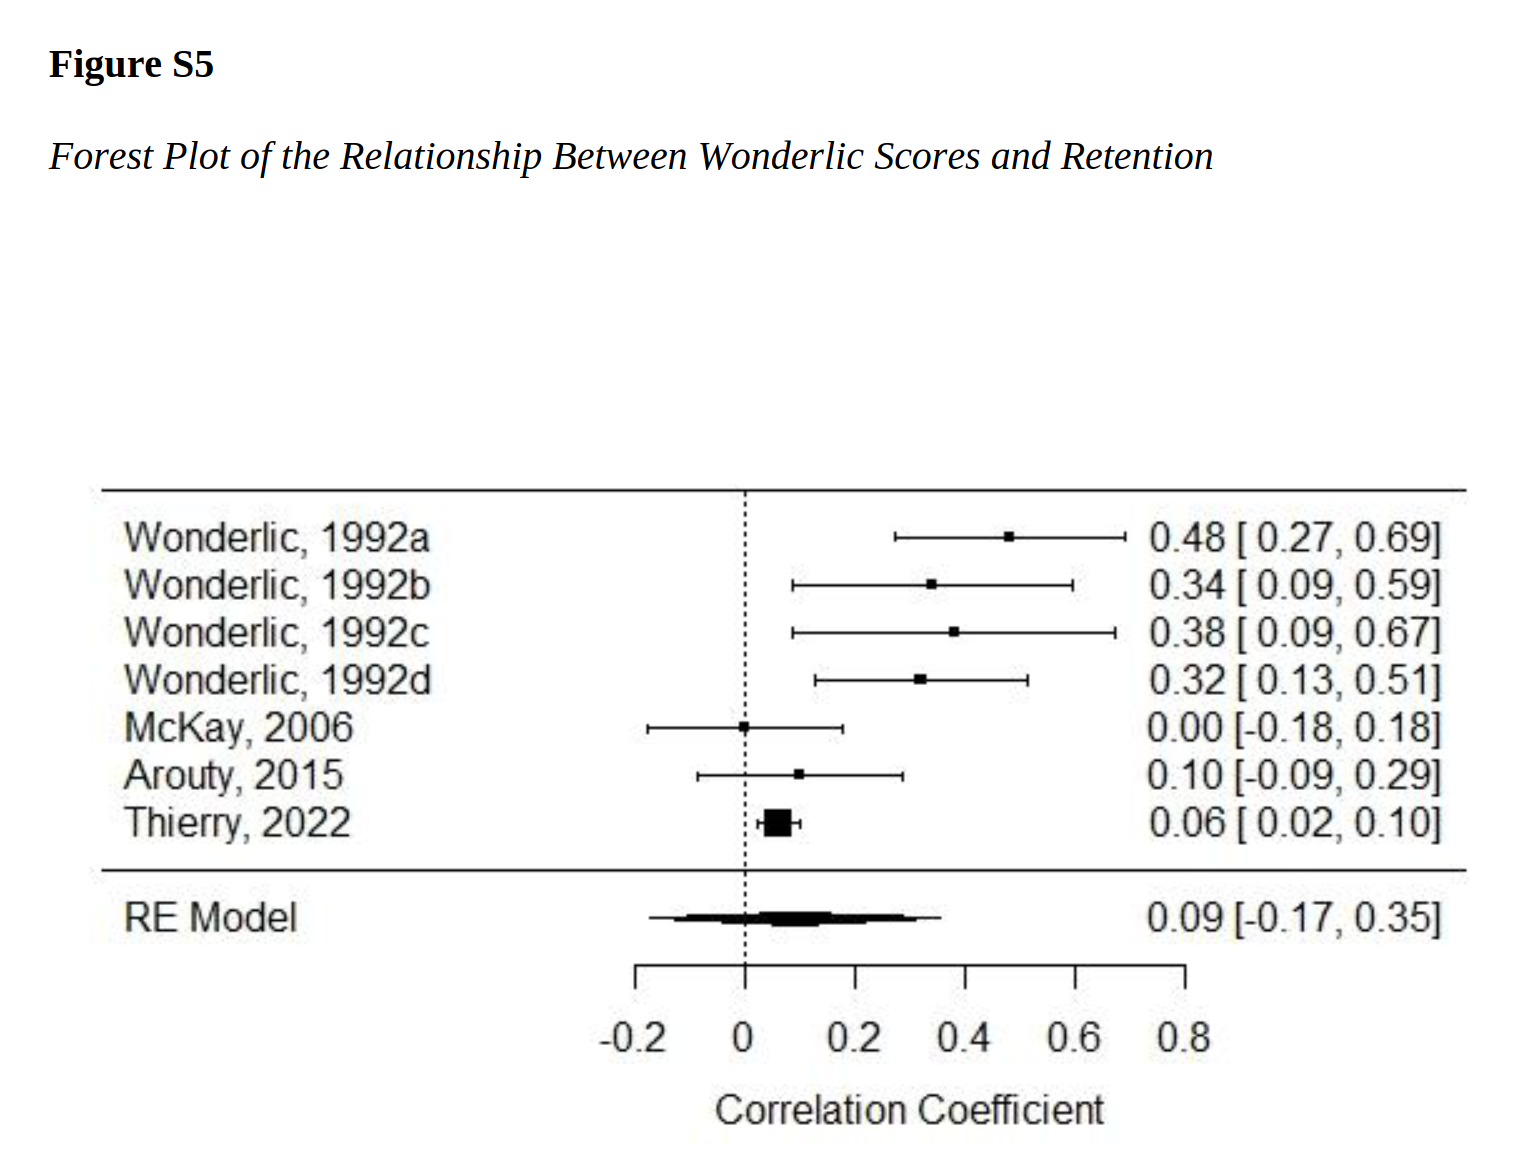
We might wonder, however, if this difference has more to do with the changing student cohorts from the early 1990s to the 2006-2022 period. Universities are these days obsessed with keeping everybody enrolled (🤑), this might make the correlation weaker. On the other hand, the same discrepancy was seen for the validity for predicting academic performance:
Although not statistically significant when included with other moderators in meta-regression, the relationship between Wonderlic scores and GPA appeared to be higher for those effect sizes sourced from the publisher’s manual (𝛒 = .47) in comparison to peer-reviewed (𝛒 = .35) or dissertation/thesis (𝛒 = .26) sources.
With regards to group differences, they report results for the usual gaps:
First, the correlations of Wonderlic scores with several ethnicity variables found that Whites scored higher than non-Whites (r̄ = -.22, d = -.45), Whites and Asians scored similarly to one another (r̄ = .05 [95% CI = -.08, .18], d = .10), Whites scored higher than Hispanics (r̄ = -.23, d = -.47), and Whites scored higher than Blacks (r̄ = -.32, d = -.68). Second, men tended to score slightly higher than women on the Wonderlic (r̄ = .11, d = .22). Third, age was largely uncorrelated with Wonderlic scores (r̄ = .04 [95% CI = -.01, .08], d = .08). Finally, SES was positively correlated with Wonderlic scores (r̄ = .20) such that individuals who were from higher SES backgrounds tended to score higher on the Wonderlic.
These gaps are without range correction, with range restriction corrected, they are:
The corrected correlation between White (0) versus Black (1) was -.39 which translates to a Cohen’s d of .85. The corrected correlation between Female (0) and Male (1) was .14 which translates to a Cohen’s d of .28.
As before, these are without adjusting for the reliability of the test, since the authors were interested in operational validity. If we apply the usual formula again here, we get gaps of:
- White vs. non-White: d = 0.45 (raw mean) -> d = 0.49 (reliability correction)
- White vs. Asian: d = -0.10 d (raw mean) -> d = 0.11 (reliability correction)
- White vs. Black: d = 0.68 (raw mean) -> d = 0.85 (range correction) -> d = 0.92 (both corrections)
- White vs. Hispanic: d = 0.47 (raw mean) -> d = 0.51 (reliability correction)
- Men vs. Women: d = 0.22 (raw means) -> d = 0.28 (range correction) -> d = 0.30 (both corrections)
The race gaps are still a bit on the same side even after the corrections (e.g. Black-White 13.8 IQ), but the sex one is on the larger side, equivalent to an IQ gap of 4.5. Still, everything looks roughly correct. Asians scored higher than Whites, though it was not p<.05 (1.7 IQ). It should be recalled that the confidence intervals of these results mean that the usual values are consistent with these as well.