There’s a wide variety of different ways to measure (general) intelligence, or what researchers call g. One can estimate vocabulary size, query about verbal analogies, general knowledge, ask people to figure out the next number or figure in a series, test their mental arithmetic skills, ability to recall digits (maybe in reverse order), and many other things. One can even measure their reaction times on various simple tasks, such as pressing a button as soon as a light turns on or a sound plays (called simple reaction time). These very simple speed measures are generally called elementary cognitive tests, or ECTs. The score is measured in milliseconds, usually as average of many attempts (trials) since the signal is very weak in each individual attempt. While this idea may seem unpromising, and was widely believed to be fruitless due to a bad early study, Arthur Jensen and other researchers later managed to resurrect this field of research. Such research showed a number of interesting things (figures from Jensen 2006 unless otherwise noted):
- The simplest tasks show the weakest correlations with g. The more complex the task, the stronger the correlation between average reaction time and g.

Bits is a transformation of the number of possible buttons where one must press the right one (with the light on) as fast as possible. So 0 bit = 1 button (no choice), 1 bit = 2 buttons, 2 bits = 4, 3 bits = 8.
- Larger within-person variation in reaction times also correlates negatively with g

An illustration of this effect. Usually, the standard deviation (SD) of reaction times correlates a bit more negatively with g than does the average reaction time. Overall brain speed is important, but consistency is too.
- Reaction times improve during maturation and decline with age, as other tests do

- If many different reaction time metrics are combined, their general score is very strongly, about r = .70, correlated with g.

A few studies have been done looking into this relationship, but no one produced a nice plot for me to use here. However, I have a copy of the data from a study with some 500 American kids who took many tests. The results look like this:

The scores are from a structural equation model, so these don’t have random measurement issues. It seems that if one had a perfectly reliable measure of chronometric intelligence (mental speed) it would correlate about .75 with regularly measured intelligence, also measured without random error. This approaches the g-loading of a vocabulary or general knowledge test, which is good. However, it is much easier and cheaper to give the knowledge tests.
The advantage of these ECTs is that they are even more culture-reduced than the regular tests. This comes in handy, in theory, for between-culture measurements. Since many of these tasks just involve pressing a button as quickly as possible in response to a light/sound, it is difficult to imagine a cultural bias related to learning. One could still imagine some other kinds of training effects that were unevenly distributed by culture (video games?), but still, it would be an independent line of evidence.
Race differences in elementary cognitive tests
The old debate about the influence of measurement bias in explaining various observed group differences (race, sex, countries, social classes etc.) was mainly settled using statistical tests of measurement invariance (test bias). However, additional evidence came from the use of these ultra-simple tests. The usual hereditarians published studies showing that race gaps exist on these tests too. Here’s Richard Lynn in 1990:
- Lynn, R., & Holmshaw, M. (1990). Black-white differences in reaction times and intelligence. Social Behavior and Personality: an international journal, 18(2), 299-308.
350 black South African 9-year-old children were compared with 239 white British children on the Standard Progressive Matrices and 12 reaction time tests giving measures of decision times, movement times and variabilities in tasks of varying complexity. The black children obtained a mean IQ of approximately 65. They also had slower decision times and greater variabilities than the white children, but they had faster movement times. The magnitude of the white advantage on decision times was 0.68 of a standard deviation, about one-third of the white advantage on the Progressive Matrices. The result suggests that around one-third of the white advantage on intelligence tests may lie in faster information processing capacity.
And Arthur Jensen in 1993:
- Jensen, A. R. (1993). Spearman’s hypothesis tested with chronometric information-processing tasks. Intelligence, 17(1), 47-77.
To account for the highly variable size of the mean difference between representative samples of the white and black populations on various psychometric tests of cognitive performance, Spearman (1927) suggested the hypothesis that the relative size of the mean white-black difference (in standardized scores) on various mental tests is a direct function of the tests’ different loadings on the general factor, psychometric g, the highest order common factor in all complex tests of cognitive ability. This hypothesis has been borne out by numerous studies based on conventional psychometric tests. The present studies, based on large groups of elementary schoolchildren, extend the test of Spearman’s hypothesis to performance on reaction time variables in simple information-processing tasks intended to minimize intellectual and cultural content. The variables’ g loadings were estimated by their correlations with Raven’s Matrices. Spearman’s hypothesis was borne out significantly and at least as strongly as in previous studies based on conventional psychometric tests.
Both studies found African ancestry children living in the West did worse than Europeans, as in, they had slower reaction times. This is more so the case for the more complex tasks, which also have higher correlations with regularly measured intelligence. Spearman’s hypothesis worked out yet again.
But both authors also studied European vs. East Asian ancestry comparisons. Lynn in 1991:
- Lynn, R., & Shigehisa, T. (1991). Reaction times and intelligence: A comparison of Japanese and British children. Journal of Biosocial Science, 23(4), 409-416.
Japanese and British 9-year-old children were compared on the standard progressive matrices and twelve reaction time parameters providing measures of simple and complex decision times, movement times and variabilities. The mean of the Japanese children on the progressive matrices exceeded that of the British children by 0·65 SD units and on the decision times component of reaction times by 0·50 SD units, suggesting that the high Japanese mean on psychometric intelligence is largely explicable in terms of the more efficient processing of information at the neurological level. Japanese children also showed faster movement times but, contrary to expectation, had greater variabilities than British children.
And Jensen in 1993:
- Jensen, A. R., & Whang, P. A. (1993). Reaction times and intelligence: A comparison of Chinese-American and Anglo-American children. Journal of biosocial science, 25(3), 397-410.
Chinese-American and Anglo-American school children were compared on a nonverbal test of intelligence (Raven’s Progressive Matrices) and on twelve chronometric variables which measure the speed with which basic information processes (e.g. stimulus apprehension, decision, and discrimination) can be carried out. All of these tasks are correlated with psychometric intelligence. The two groups differed significantly on most of the variables, but the differences appear to be multidimensional and are not simply due to a group difference in psychometric intelligence, equivalent to about 5 IQ points in favour of the Chinese-Americans. The results are compared with those of Lynn and his colleagues on British, Japanese, and Hong Kong children, and both consistencies and inconsistencies are found.
The results were unclear for this comparison. This probably means you shouldn’t be invoking the intelligence difference to explain East Asian video game superiority, at least insofar as reaction times are concerned.
But these are old studies and done by famous hereditarians, so a critic might demand something newer. Indeed, Drew Thomas published a critical note on Lynn’s paper in 2011. So I checked the citations of these papers and found that there are some more replications.
- Saccuzzo, D. P., Johnson, N. E., & Guertin, T. L. (1994). Information processing in gifted versus nongifted African American, Latino, Filipino, and White children: Speeded versus nonspeeded paradigms. Intelligence, 19(2), 219-243.
This study was tiny (20 per race), however, so uninformative, and it’s also old.
- Van De Vijver, F. J. (2008). On the meaning of cross-cultural differences in simple cognitive measures. Educational Research and Evaluation, 14(3), 215-234.
A set of 5 reaction time tests of increasing cognitive complexity were administered to 35 secondary school pupils in Zimbabwe and The Netherlands at 4 consecutive school days in order to explore the existence and nature of cross-cultural differences on reaction time tests measuring basic cognitive operations. No cross-cultural differences were observed on the simple tests, while the Dutch pupils were faster than Zimbabwean pupils on the more complex tests. Zimbabwean pupils showed larger performance increments at retesting. Two Wechsler Intelligence Scale for Children (WISC) subtests (Vocabulary and Digit Span Forward and Backward), a tapping test, and parental socioeconomic status were used to predict the cross-cultural performance differences. Socioeconomic status and digit span could explain all these differences. It is argued that the cross-cultural performance differences on elementary cognitive tests cannot be interpreted at face value because of their susceptibility to non-target factors, such as test understanding and previous test exposure.
This study was larger (n = 35 per country) and used Zimbabwean in their own country. It showed this pattern:
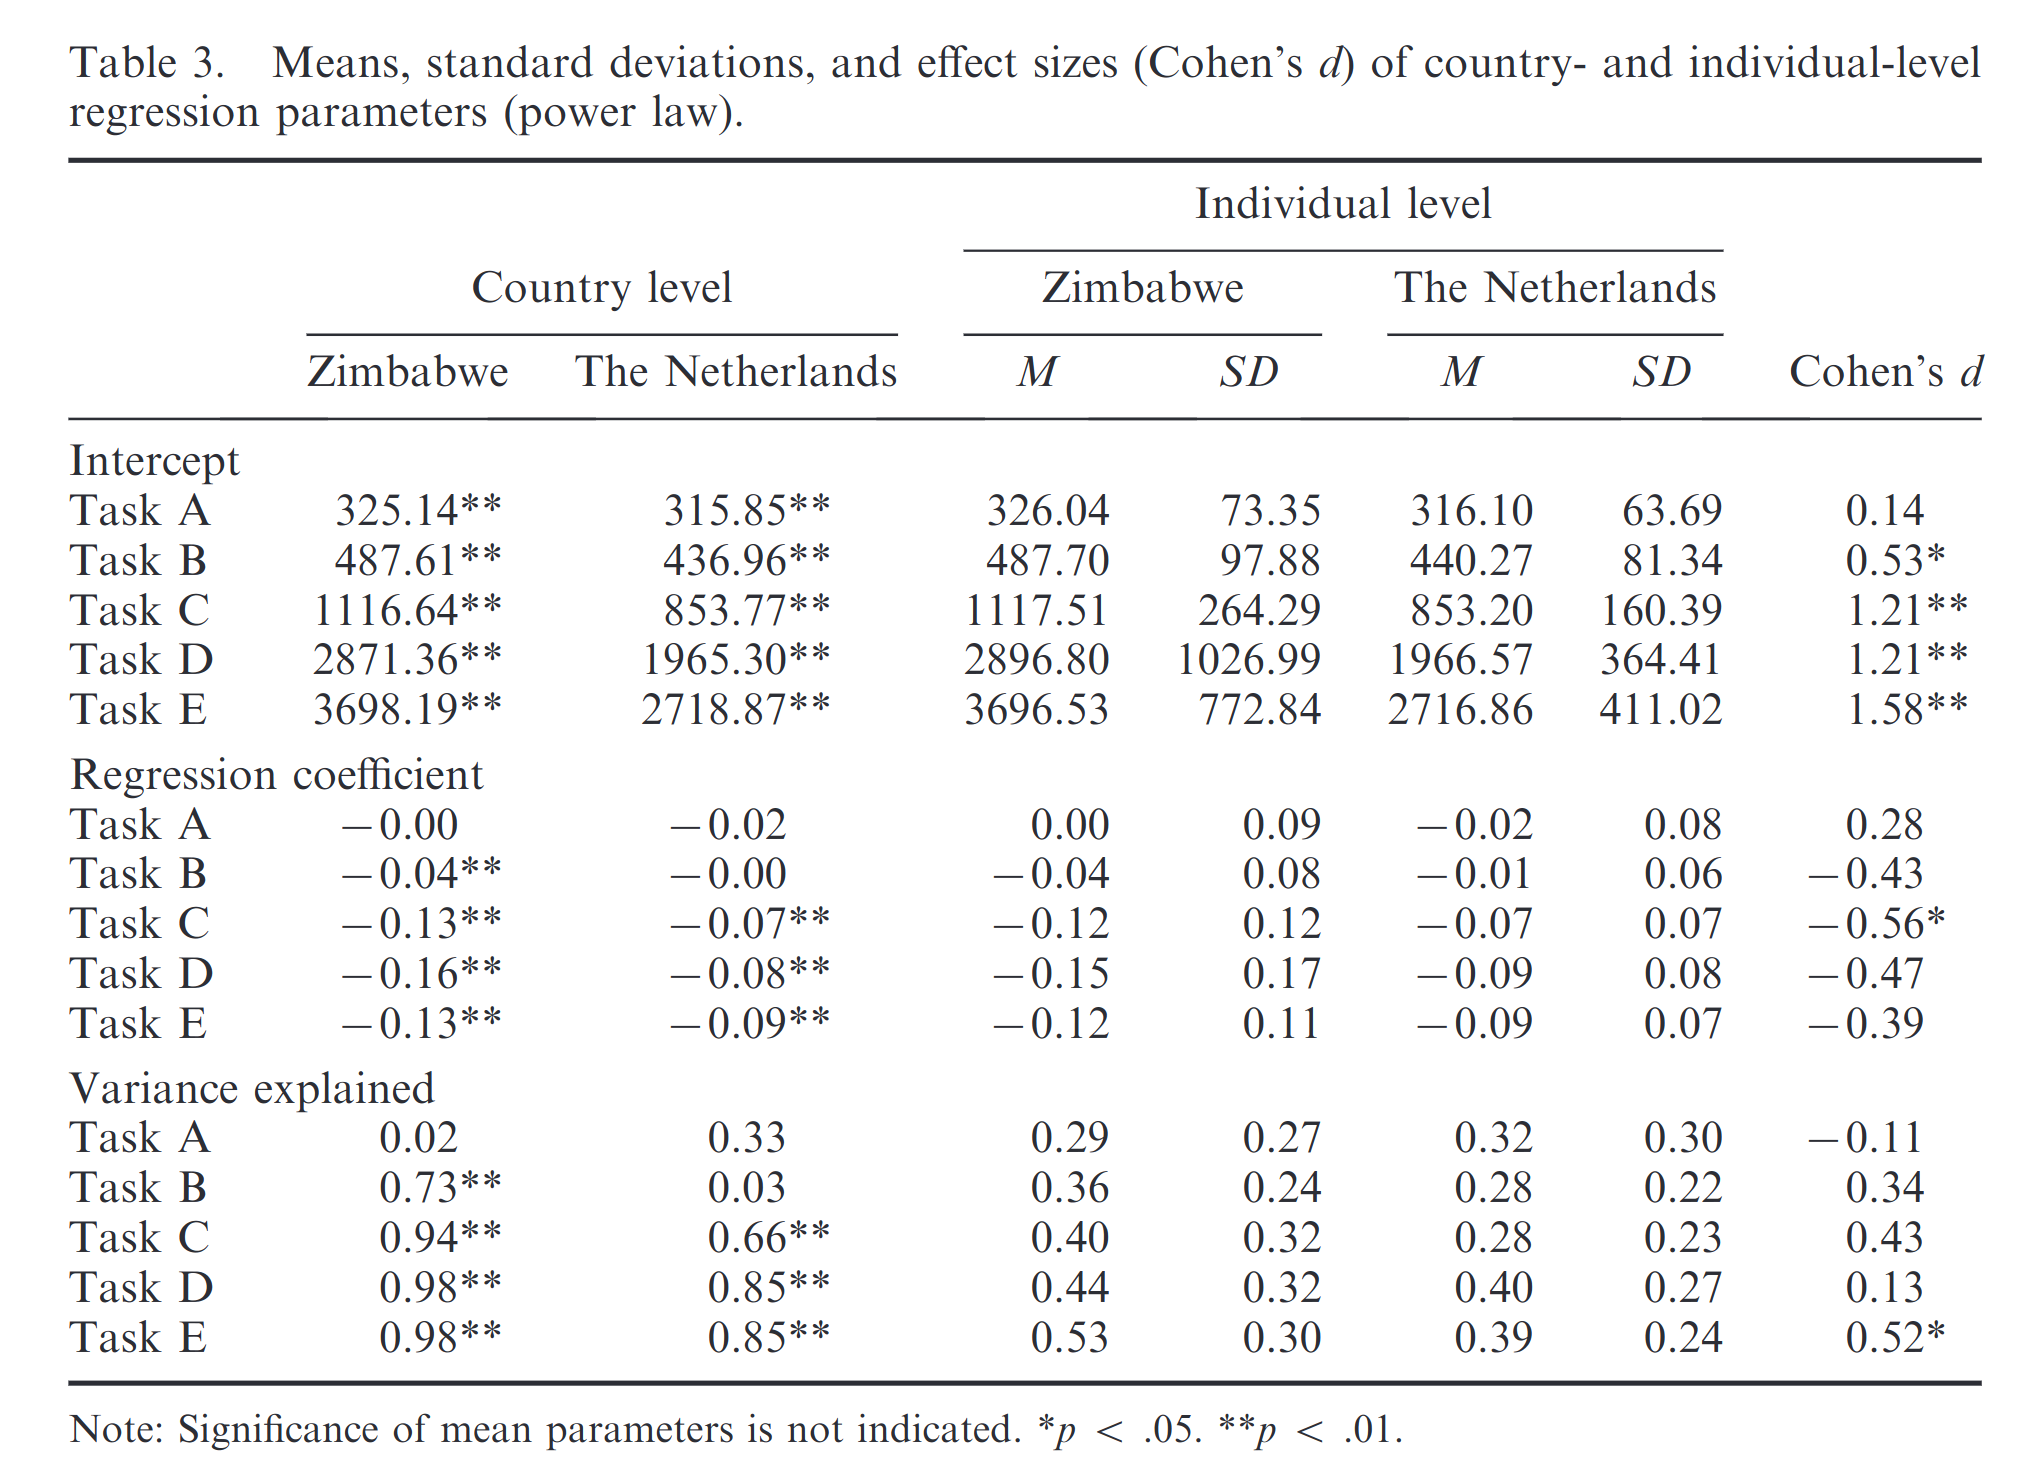
The intercept is the mean (I think), and task A-E are different and increasingly complex tasks, A is simple reaction time (press button, no choice). To note here is that the Dutch children were also slightly more than 2 years younger. This means they are somewhat handicapped in the comparison but were still faster.
- Sonke, C. J., Van Boxtel, G. J., Griesel, D. R., & Poortinga, Y. H. (2008). Brain wave concomitants of cross-cultural differences in scores on simple cognitive tasks. Journal of cross-cultural psychology, 39(1), 37-54.
Interpretations of cross-cultural differences in performance on cognitive tasks tend to rely on broad concepts, such as general intelligence or cultural modes of thinking. In this study, the authors examine two proximate parameters, stimulus complexity and task exposure, using reaction time (RT) and event-related brain potentials (ERPs) recorded during various tasks. Five tasks differed in complexity but had similar stimulus content; one task had stimuli of different appearance. Test trials were administered across three days. Participants were trained on most tasks for two days. There were three samples, rural Venda youngsters in South Africa with little schooling, Venda university students, and Dutch university students. Cross-cultural differences in RT increased with task complexity and decreased with exposure. Substantial correspondence was found between patterns of RT and latency of the N2, an ERP component related to stimulus categorization. Our results fit an explanation in terms of task familiarity. Implications for culture-cognition relationships are discussed.
The study compared 3 groups:
Three samples of volunteers participated. The first consisted of rural youngsters from the Venda region in Northern Transvaal, South Africa (N = 26, 14 male; mean age = 16.9; SD = 2.4 years), with at most 5 years of education (M = 3.1; SD = 1.2 years) in schools with very low educational standards. The second sample consisted of students at the University of Venda, South Africa (N = 29, 15 male; mean age = 23.8, SD = 2.0 years). Students at Tilburg University, the Netherlands, made up the third sample (N = 30, 15 male; mean age = 20.2, SD = 2.2 years).
So it is not that fair a comparison because the Dutch were university students at the optimal age, and one African group was 17 years old. But still, results look like this:
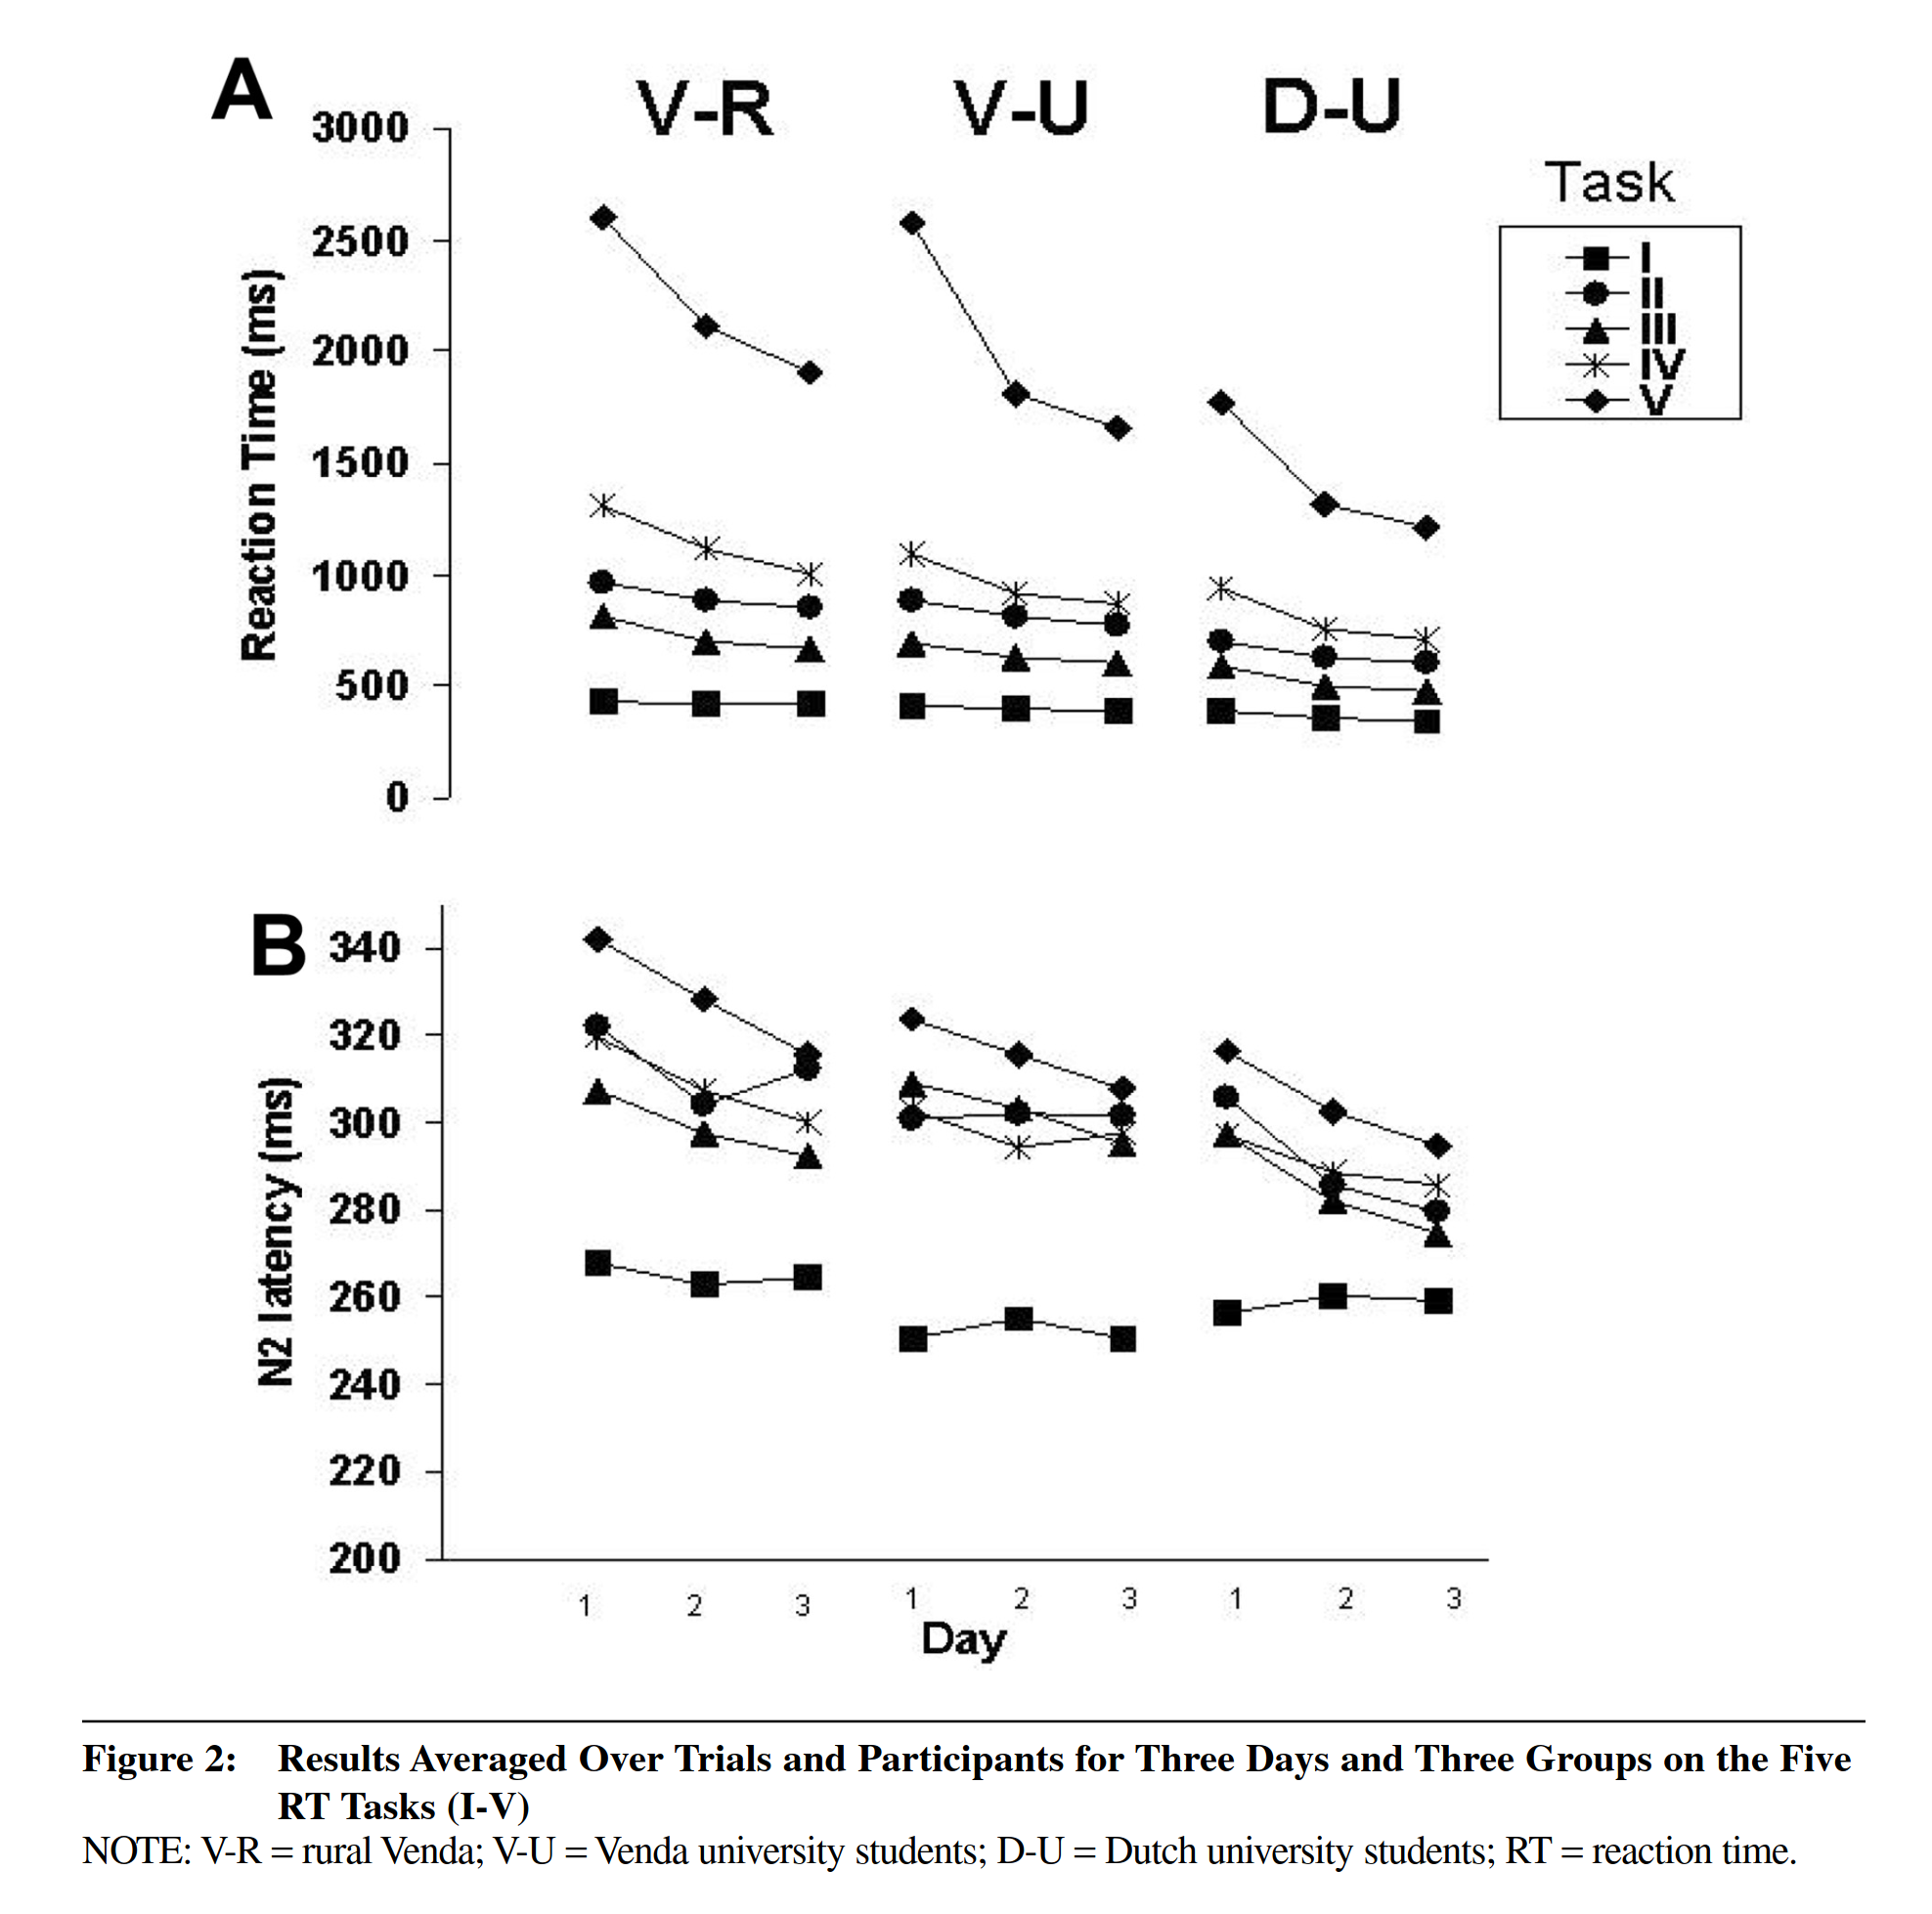
The Dutch students were faster than both African groups. The two African groups didn’t show much difference related to education or age, which is odd.
- Kontos, A. P., Elbin III, R. J., Covassin, T., & Larson, E. (2010). Exploring differences in computerized neurocognitive concussion testing between African American and White athletes. Archives of clinical neuropsychology, 25(8), 734-744.
The purpose of the current study was to explore potential differences in pre- and post-concussion performance on a computerized neurocognitive concussion test between African American and White high-school and collegiate student-athletes. A prospective case–control design was used to compare baseline and 2- and 7-day post-concussion computerized neurocognitive performance and symptoms between 48 White and 48 African American athletes matched for age, gender, and concussion history. The Immediate Post-Concussion Assessment Cognitive Test (ImPACT) version 2.0 (NeuroHealth System, LLC, Pittsburgh, PA, USA) computer software program was used to assess neurocognitive function (i.e., verbal and visual memory, motor processing speed, and reaction time) and concussion symptoms. Regardless of race/ethnicity, there were significant decrements in computerized neurocognitive performance and increased symptoms following a concussion for the entire sample. African Americans and Whites did not differ significantly on baseline or post-concussion verbal memory, visual memory, reaction time, and total reported symptoms. However, African American participants were 2.4× more likely to have at least one clinically significant cognitive decline on ImPACT at 7 days post-concussion and scored lower at 7 days post-concussion compared with baseline on processing speed than White participants. The authors concluded that the baseline ImPACT test was culturally equivalent and construct valid for use with these two racial/ethnic groups. However, in contrast, the findings support deleterious performance for the African American athletes compared with the White athletes on the ImPACT post-concussion evaluation that is of critical clinical relevance and warrants further research.
This study of athletes found no difference, not even in regularly measured intelligence, so it probably has selection bias issues.
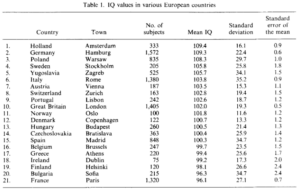
- Levav, M., Mirsky, A. F., French, L. M., & Bartko, J. J. (1998). Multinational neuropsychological testing: Performance of children and adults. Journal of Clinical and Experimental Neuropsychology, 20(5), 658-672.
We obtained neuropsychological assessment data on persons from five countries whose ages range from 8 to 90 years. Participants were assessed in four languages. The results from the multivariate analyses indicate that reaction-time measures obtained in tests of sustained attention are minimally affected by country of origin and level of education. In contrast, tests assessing the ability to focus attention and solve a problem, to shift strategies, and to inhibit an automatic response tendency differ significantly by country and level of education. Most of these differences tend to disappear at about the age of 54. The data provide partial support for the hypothesis of commonality of some neuropsychological functions across cultures.
This study actually found that Ecuadorians were faster than the Western populations on 2 different tasks.
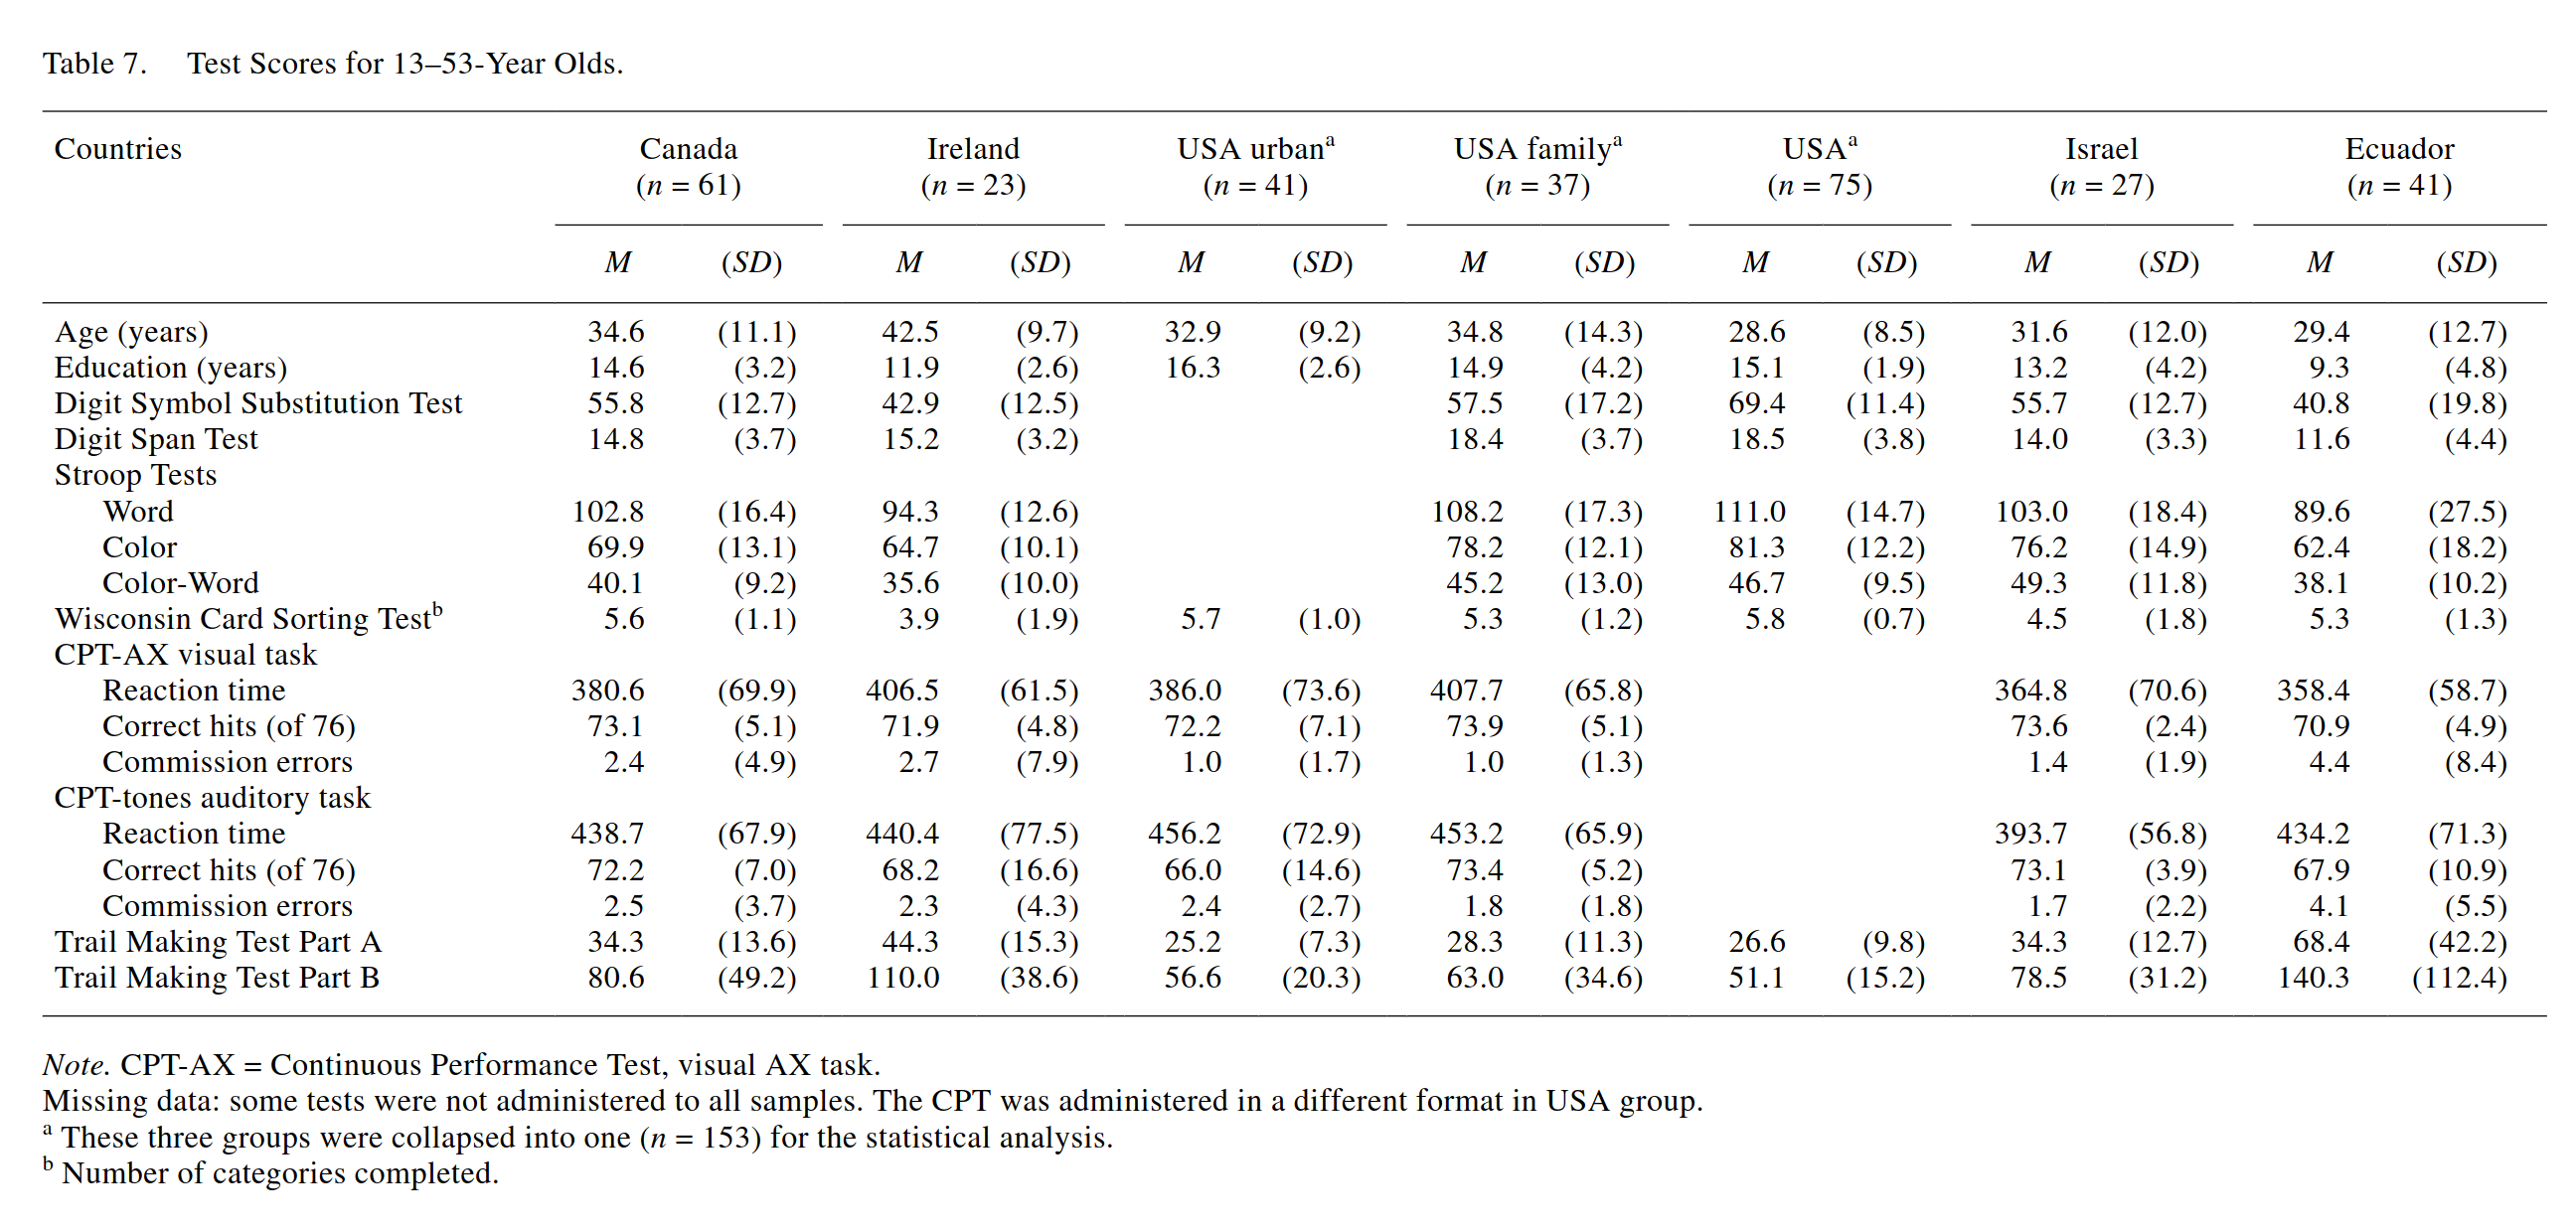
Interpretation of these surprising findings is difficult because:
Our findings have several limitations. Many of the participants were from clinical samples (Canada, Israel, Ireland), which reduces the possibility of generalizing to populations. These persons participated in studies as members of families containing a proband with a neuropsychiatric disorder or as controls for such persons. Only the adult samples from the USA were screened for neuropsychiatric disorders. Children in Baltimore (USA), Montreal (Canada) and in Jerusalem (Israel) were not screened for specific disorders. The children from Ecuador had medical, neurological, and developmental assessments; many of them suffered from malnutrition and parasitic infections.
Conclusions
- Africans were slower than Europeans on reaction time tasks across countries, samples, and research teams
- East Asian vs. European comparisons were complicated, no clear picture
- One large study found Ecuadorians were faster than Westerners
My interpretation of this literature review is that other factors than general intelligence may affect reaction times between populations, so that it is perhaps not a good measure of intelligence between groups. In psychometric terms, there may be differences in non-g speed factors affecting these tests, so that the mean levels will not reflect mean levels of intelligence between groups. The comparison does ‘work’ for Africans and Europeans, so maybe Lynn and Jensen simply got lucky with this particular comparison. Or maybe the Ecuadorian results are off for some reason. East Asian and European average intelligence is almost the same, so it is not so surprising these results are not so clear, as only small 3rd factors may throw off results in comparison to a g-only model. Overall, the literature is hard to interpret because every study used a different approach. The ABCD dataset has various reaction time measures as well as a large, representative sample of children from USA belonging to many different races, so looking into the details of these results may be a good next step. Unfortunately, they again used a different approach than the 1, 2, 4, 8 button approach used in many of the earlier studies.
An alternative approach is to collect some new data using the internet. There are many websites that administer reaction time tests, and even some of the electric scooter apps require you to take a test to prove you ain’t drunk. Maybe one of these websites can be convinced to sharing their data with IP-based country information for analysis.